What's Your Most Active Fabric Workspace?
Principal Program Manager, Microsoft Fabric CAT helping users and organizations build scalable, insightful, secure solutions. Blogs, opinions are my own and do not represent my employer.
Semantic Link Labs v0.8.3 has list_activities method to get the list of all activities in your Fabric tenant. It uses the same Power BI Admin - Get Activity Events API but this API now also includes Fabric activities. Note that this is an Admin API so you need to be a Fabric administrator. Check the API details.
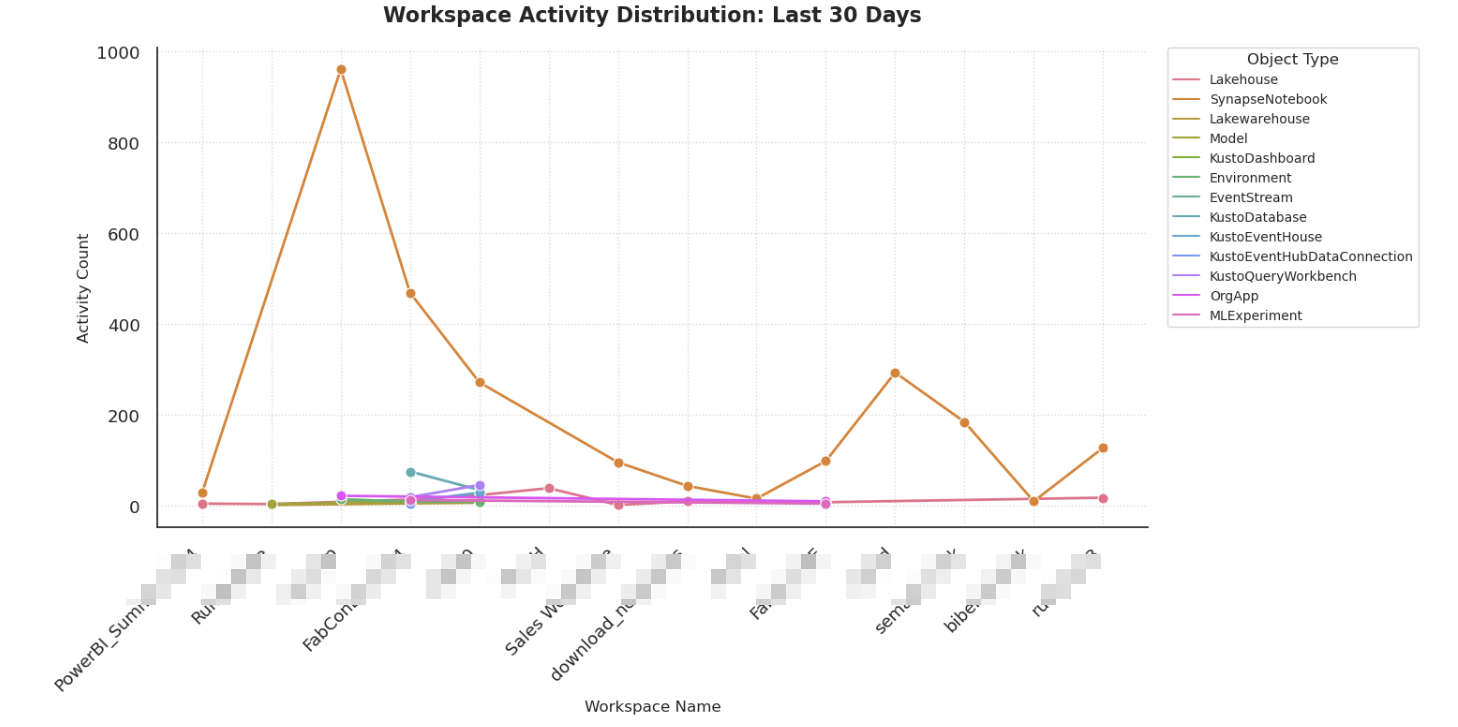
To answer the above question, I will use the admin.list_activity_events , loop over the last 30 days and plot the results by Fabric item type in my personal tenant:
from datetime import datetime, timedelta
import seaborn as sns
import matplotlib.pyplot as plt
import pandas as pd
import sempy_labs as labs
import numpy as np

#number fo days to scan
N=30

activities = []
for n in range(N):
    day = datetime.now() - timedelta(days=n)
    start_of_day = day.replace(hour=0, minute=0, second=0, microsecond=0).strftime('%Y-%m-%dT%H:%M:%S')
    end_of_day = day.replace(hour=23, minute=59, second=59, microsecond=999999).strftime('%Y-%m-%dT%H:%M:%S')

    df = labs.admin.list_activity_events(
        start_time=start_of_day,
        end_time=end_of_day
    ).groupby(['Workspace Name', 'Object Type'])['Request Id'].count().reset_index().assign(day=start_of_day)
    activities.append(df)

df_cleaned = pd.concat(activities).reset_index(drop=True)
df_cleaned = df_cleaned[df_cleaned.astype(str).apply(lambda x: x.str.strip().astype(bool))].dropna()
df_cleaned = df_cleaned.replace([np.inf, -np.inf], np.nan).dropna()
df_cleaned = df_cleaned.rename(columns={"Request Id": "Activity Count"})

plt.style.use('seaborn-v0_8')
sns.set_style("white")
sns.set_context("notebook", font_scale=1.2)

fig, ax = plt.subplots(figsize=(15, 8))
sns.lineplot(data=df_cleaned, x="Workspace Name", y="Activity Count",
             hue="Object Type", marker='o', linewidth=2, markersize=8, errorbar=None)

plt.title(f"Workspace Activity Distribution: Last {N} Days", pad=20, fontsize=16, fontweight='bold')
plt.xlabel("Workspace Name", fontsize=12)
plt.ylabel("Activity Count", fontsize=12)
plt.xticks(rotation=45, ha='right')
plt.grid(True, linestyle=':', alpha=0.3, color='gray')
plt.legend(title="Object Type", title_fontsize=12, bbox_to_anchor=(1.02, 1),
          loc='upper left', frameon=True, borderaxespad=0, fontsize=10)

sns.despine()
plt.tight_layout()
plt.show()
Unsurprisingly, I use lakehouse and notebooks the most 😁
Note this API has a limitation of 200 requests per hour. To limit the scope, specify activity_filter and user_id_filter in the arguments. The activities are super granular, e.g. GenerateScreenshot, GetCloudSupportedDatasources etc. and some could be system generated so be sure to include only relevant activities in your analysis. I am the only user in my personal tenant and use it may be for ~30 min every day and still generated thousands of activities. If you have a large tenant, I would highly recommend saving all the logs to an Eventhouse on a daily basis for analysis. You can use the Kusto SDK or the Kusto Spark Connector in a notebook to ingest the data in the KQL table.