Fabric-RLM : Working With Semantic Models
Use Fabric-RLM to generate a report on schedule in a notebook
In this post I'll show how to connect Fabric-RLM to a Power BI semantic model in Fabric and turn it into an insightful report. For conversational questions about your data you already have Copilot in Power BI, Fabric data agents, and the Power BI and Fabric IQ MCP servers. Fabric-RLM is for a different job: combining several data sources, working out the insights, and producing business artifacts such as HTML or Markdown reports and Excel workbooks.
Connect
You need a Fabric notebook in a workspace on a paid Fabric capacity
%pip install -q "fabric-rlm[analytics]==0.6.8"

from fabric_rlm import RLM, SemanticModel, FabricLM

# SemanticModel("ecommerce_dataset", workspace ="..")
model = SemanticModel("ecommerce_dataset")

lm = FabricLM("gpt-5.1", reasoning_effort="high")
You bind the model into the run as an input. You can add multiple semantic models as well. Inside the run, generated code gets a handle with a few methods:
| Method | Returns |
|---|---|
model.schema() |
Tables, measures with their DAX and descriptions, relationships, columns |
model.aggregate(measures=[...], groupby=[...], filters={...}) |
A DataFrame, with names checked against the model |
model.dax("EVALUATE ...") |
Anything DAX can express |
model.period_coverage("Total Revenue") |
Which months (or quarters) are complete |
You can also call them yourself:
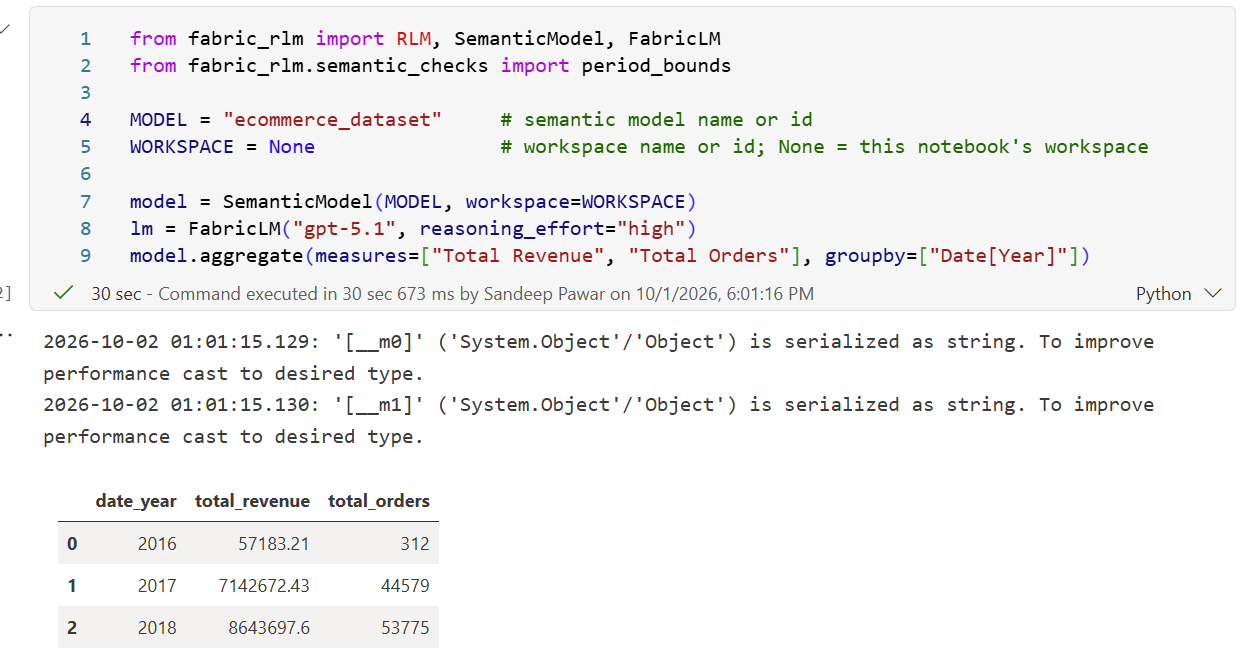
model.aggregate(measures=["Total Revenue", "Total Orders"], groupby=["Date[Year]"]) .
Ask a question
result = RLM.task(
    "Using the semantic model bound as `model`, which five product      categories had the "
    "highest revenue in 2017, and how much did each earn?",
    inputs={"model": model},
    outputs={"top_categories": dict, "answer": str},
    skills=["semantic_model"],
    lm=lm,
).run()
print(result.payload["answer"])
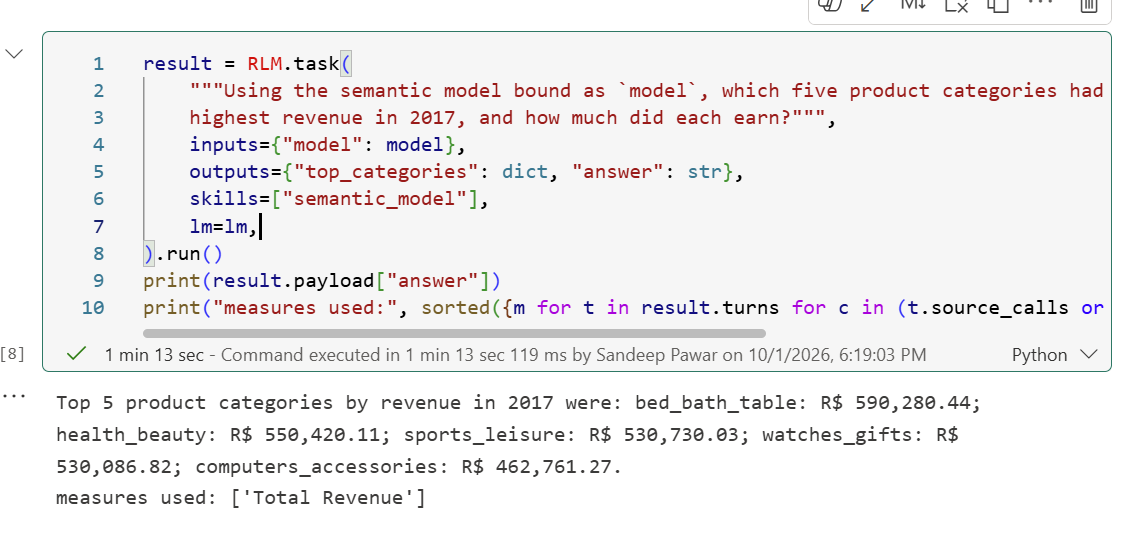
In Fabric-RLM, you define the task, inputs, output contract, skill (optional) and the LLM to use. The run records which measures and columns each query used, so you can see where every number came from.
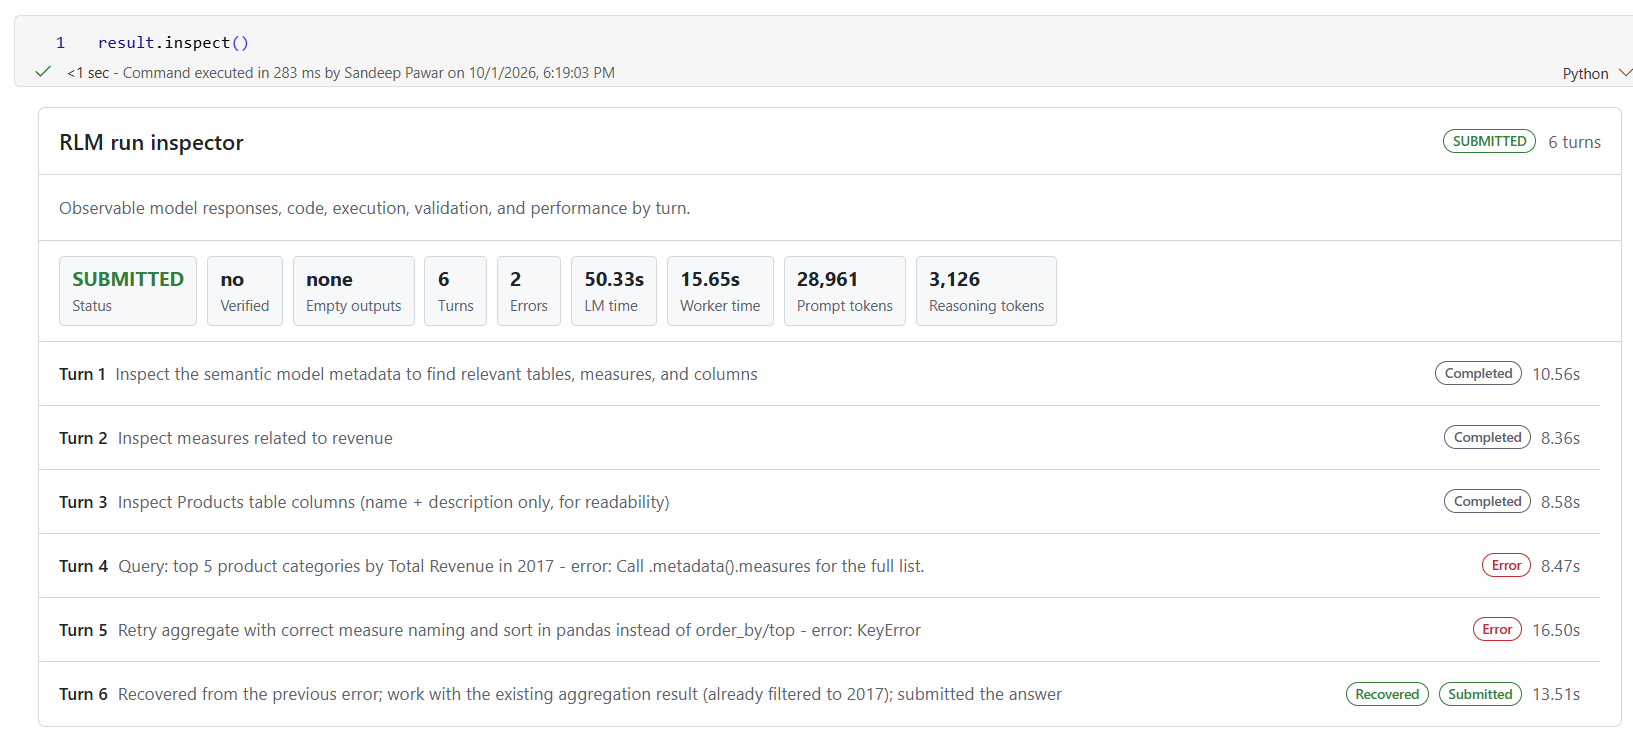
To inspect how Fabric-RLM arrived at the answer, use the .inspect() method.
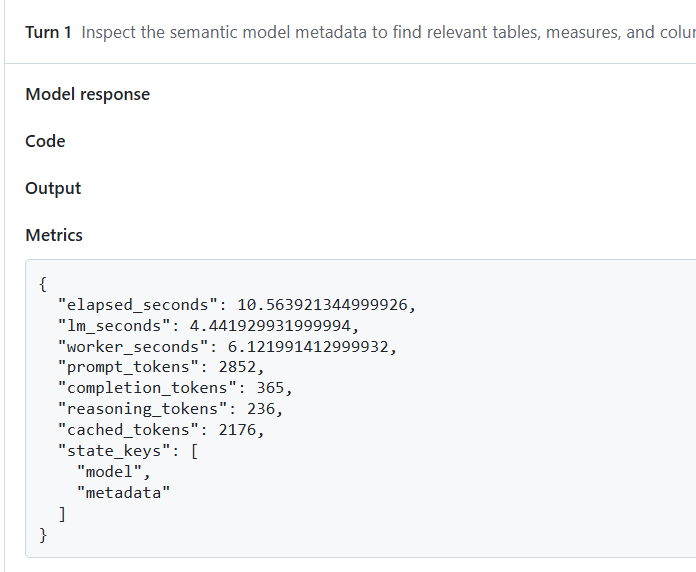
You can click on each step to see the model response, code, output of that step and the run metrics:
As you can see from the run steps, Fabric-RLM first inspected the schema, then measures, table/column descriptions, executed the DAX, corrected its own errors and finally gave the answer. The model plans, runs code, checks the result and fixes its own errors in one loop, with no separate tools or agents to orchestrate.
Ok cool but not so impressive right? Let's give Fabric-RLM a more complex task and also include validation so the host LLM knows how to check its work.
Generating Report:
Now I would like Fabric-RLM to explore the semantic model more, identify which product category's revenue changed the most and create an HTML report with visuals based on my specs
task = """Using the semantic model bound as `model`, find which product category's revenue changed the most,
up or down, between the latest complete quarter and the same quarter a year earlier, and write a polished,
self-contained HTML report for a business reader.

Sections, in this order. Every section starts with two or three sentences of plain-language explanation:
what the chart shows, the main number, and why it matters. Then the chart.
- Executive summary: three KPI cards (the headline category's change in BRL and %, the total revenue change
  across all categories, how many categories grew versus shrank), then a short paragraph on what it means.
- Where it came from: a horizontal bar chart of the five biggest increases and five biggest decreases,
  zero line in the middle, increases and decreases in two colours, category names on the axis and each
  bar's value at the end of the bar.
- Before and after: a dumbbell chart of both quarters for the six biggest movers, labelled with the
  revenue in each quarter (not the change).
- Mix shift: how the share of total revenue moved for the eight largest categories, as paired horizontal
  bars (2017 share next to 2018 share) with the share printed on each bar.
- Insights: three to five short findings, each with the number it rests on. Say what the data shows,
  not causes it cannot show.
- How this was checked: the measure, the two quarters, and that partial quarters were left out.

How to build it: compute the numbers with the model first, then draw every chart with matplotlib
(fig.savefig to an SVG string, embedded inline as <svg>), with a takeaway title such as "Watches & gifts
added BRL 232k, more than any other category", readable labels, and one consistent palette. Write amounts
as "BRL 232,342"; never put a $ sign in the text.

Keep products with no category as their own "Uncategorised" row; do not drop them. The total is [Total Revenue]
for the whole quarter.

Return report_html and headline = {category, period_from, period_to, revenue_from, revenue_to,
change_pct, total_from, total_to}."""
While this task is sufficient, I would also like to define how Fabric-RLM will know if the task is completed successfully. This is optional but for data tasks where we want to ensure consistency and accuracy, defining validation criteria helps RLM repair its work if needed.
import re
import pandas as pd
from fabric_rlm import RLM, FabricLM
from fabric_rlm.semantic_checks import period_bounds

lm = FabricLM("gpt-5.1", reasoning_effort="high")
quarters = model.period_coverage("Total Revenue", grain="quarter")


def revenue(period, category=None):
    """[Total Revenue] for one quarter: the whole quarter, or one product category. None if nothing matches."""
    start, end, _ = period_bounds(period)
    where = ""
    if category == "Uncategorised":
        where = "ISBLANK(Products[Product Category English]), "
    elif category:
        where = f'Products[Product Category English] = "{category}", '
    value = model.dax(
        f'EVALUATE ROW("v", CALCULATE([Total Revenue], {where}'
        f"'Date'[Date] >= DATE({start.year},{start.month},{start.day}), "
        f"'Date'[Date] < DATE({end.year},{end.month},{end.day})))").iloc[0, 0]
    return None if pd.isna(value) else float(value)


def check_report(payload):
    h = payload["headline"]

    # the report explains itself in words, and has no $ signs
    text = re.sub(r"<[^>]+>", " ", re.sub(r"<svg.*?</svg>|<style.*?</style>", " ", payload["report_html"], flags=re.S))
    assert len(text.split()) >= 250, "Explain each section in plain words: two or three sentences before every chart."
    assert "$" not in text, "Write amounts as BRL, without $ signs."
    assert payload["report_html"].lower().count("<svg") >= 3, "Show the findings as at least three inline SVG charts."

    # complete quarters, and the headline and totals recompute
    for period, cat_key, total_key in ((h["period_from"], "revenue_from", "total_from"),
                                       (h["period_to"], "revenue_to", "total_to")):
        assert quarters.status(period) == "complete", f"{period} is not a complete quarter; use {quarters.latest_complete}."
        for key, actual in ((cat_key, revenue(period, h["category"])), (total_key, revenue(period))):
            assert actual is not None, (
                f'"{h["category"]}" is not a value of Products[Product Category English]. Return the exact '
                'value from the model, such as watches_gifts (use display names only in the report text).')
            assert abs(actual - h[key]) <= 0.005 * actual, f"{key} in {period} should be {actual:,.2f}."
Setup:
lmpicks the model that writes the report: GPT-5.1 at high reasoning effort.quarterslooks at the data before anything else and records which quarters are complete. A half-empty quarter like 2018-Q3 is marked partial.
revenue(period, category)independently recomputes revenue with its own query. It never trusts the report's numbers.With no category, it returns total revenue for that quarter.
With a category name, it returns that category's revenue.
With
Uncategorised, it returns revenue from products that have no category.If the category name doesn't exist in the model, it returns nothing, so the check can say so instead of crashing.
check_reportruns every time the model hands in a report. If anything fails, the report goes back to the model with a message saying what to fix:Is it explained? The report must have at least 250 words of text outside the charts, so it can't be charts alone.
Does it read cleanly? No
$signs; amounts are written as BRL.Does it have charts? At least three.
Are the periods real? Both quarters being compared must be complete.
Is the category real? The headline category must be an exact name from the model, such as
watches_gifts.Are the numbers right? The headline category's revenue and the total revenue, for both quarters, must match the recomputed figures within 0.5%.
If every check passes, the report is accepted and marked verified. If the model can't fix a problem within its turns, you get no report rather than a wrong one.
Here is the final report based on the task and specs:
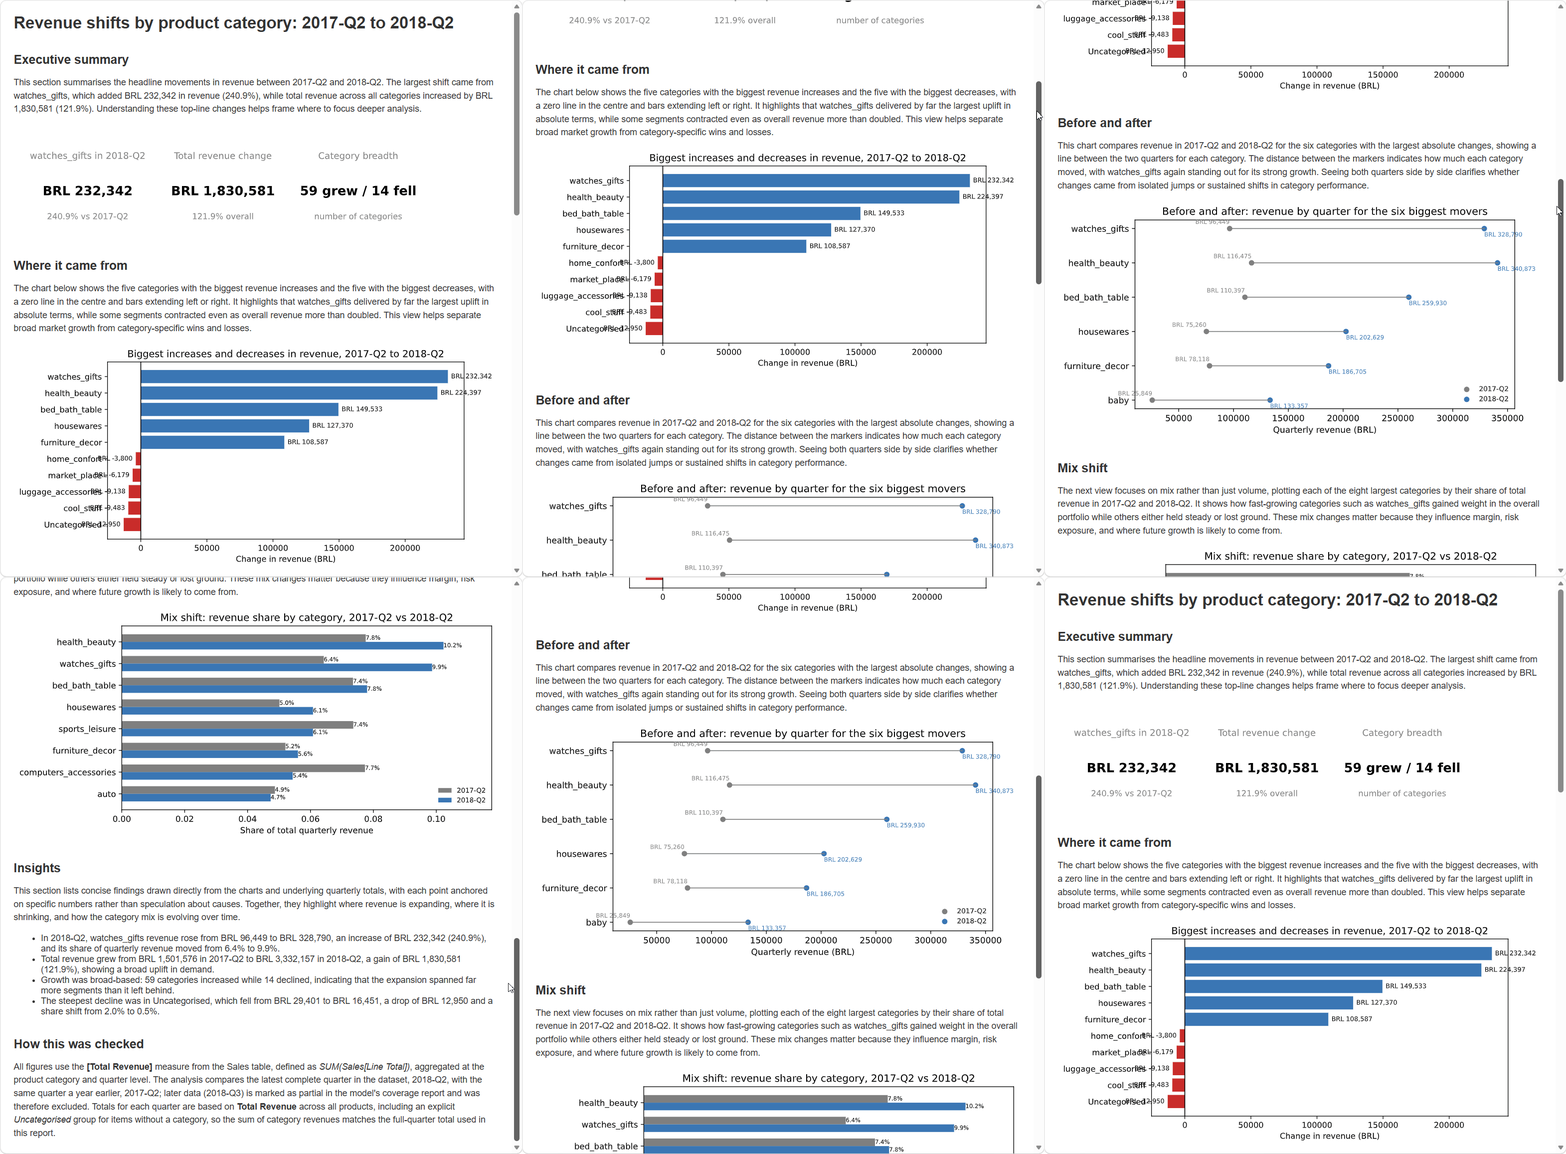
You can download the semantic model and the notebook from here : snippets/fabric-rlm/semantic_model_report.ipynb at main · pawarbi/snippets
All the numbers in this report are validated, you can ask Fabric-RLM to return queries used for each visual/insight as well.
In the next blog, I will show how to take it to the next level with the .report() method and generate insights using a semantic model + long PDFs.
About the author
Principal Program Manager, Microsoft Fabric CAT helping users and organizations build scalable, insightful, secure solutions. Blogs, opinions are my own and do not represent my employer.
Comments
Join the discussionNo comments yet. Be the first to comment.