Getting VisualIDs Of All The Visuals In A Power BI Report
Log Analytics and Workspace Monitoring in Fabric logs all the activities of datasets in a workspace. These logs contain dataset, report, visual IDs which the user has to decipher to get the full picture. Dataset, report ids are straightforward but it’s not easy to get visual IDs programmatically. Chris Webb already has a blog on couple of different ways to get the visual IDs. That blog was published in 2022 and in the Fabric world we now have a couple of more options.
Option 1: Semantic Link Labs
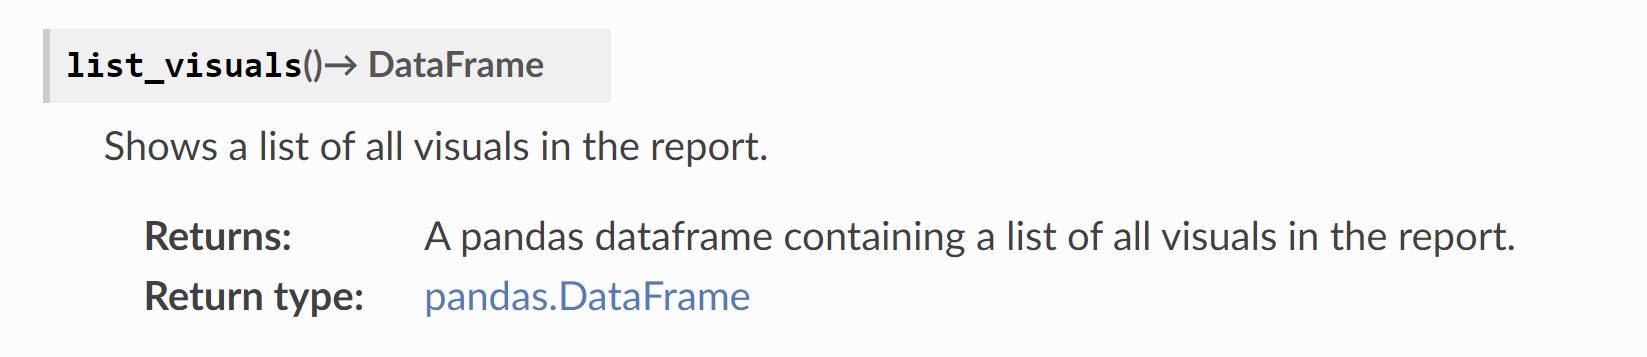
ReportWrapper in Semantic Link Labs has a .list_visuals() method which returns all the visuals along with the IDs. This is the easiest method. Currently, ReportWrapper needs the report to be in the .pbir format.
Option 2: Power BI Client
The other method, if the report is not in pbir format, is to use the Power BI Client which is installed in the default Fabric runtime.
from powerbiclient import Report
import pandas as pd
import json

ws = "de1d6a06-xxxxx-48916f38a74e"
rpt = "b7a6011a-xxxx-0c5466d38347"
report = Report(group_id=ws, report_id=rpt)
report

df_pages = pd.json_normalize(report.get_pages())
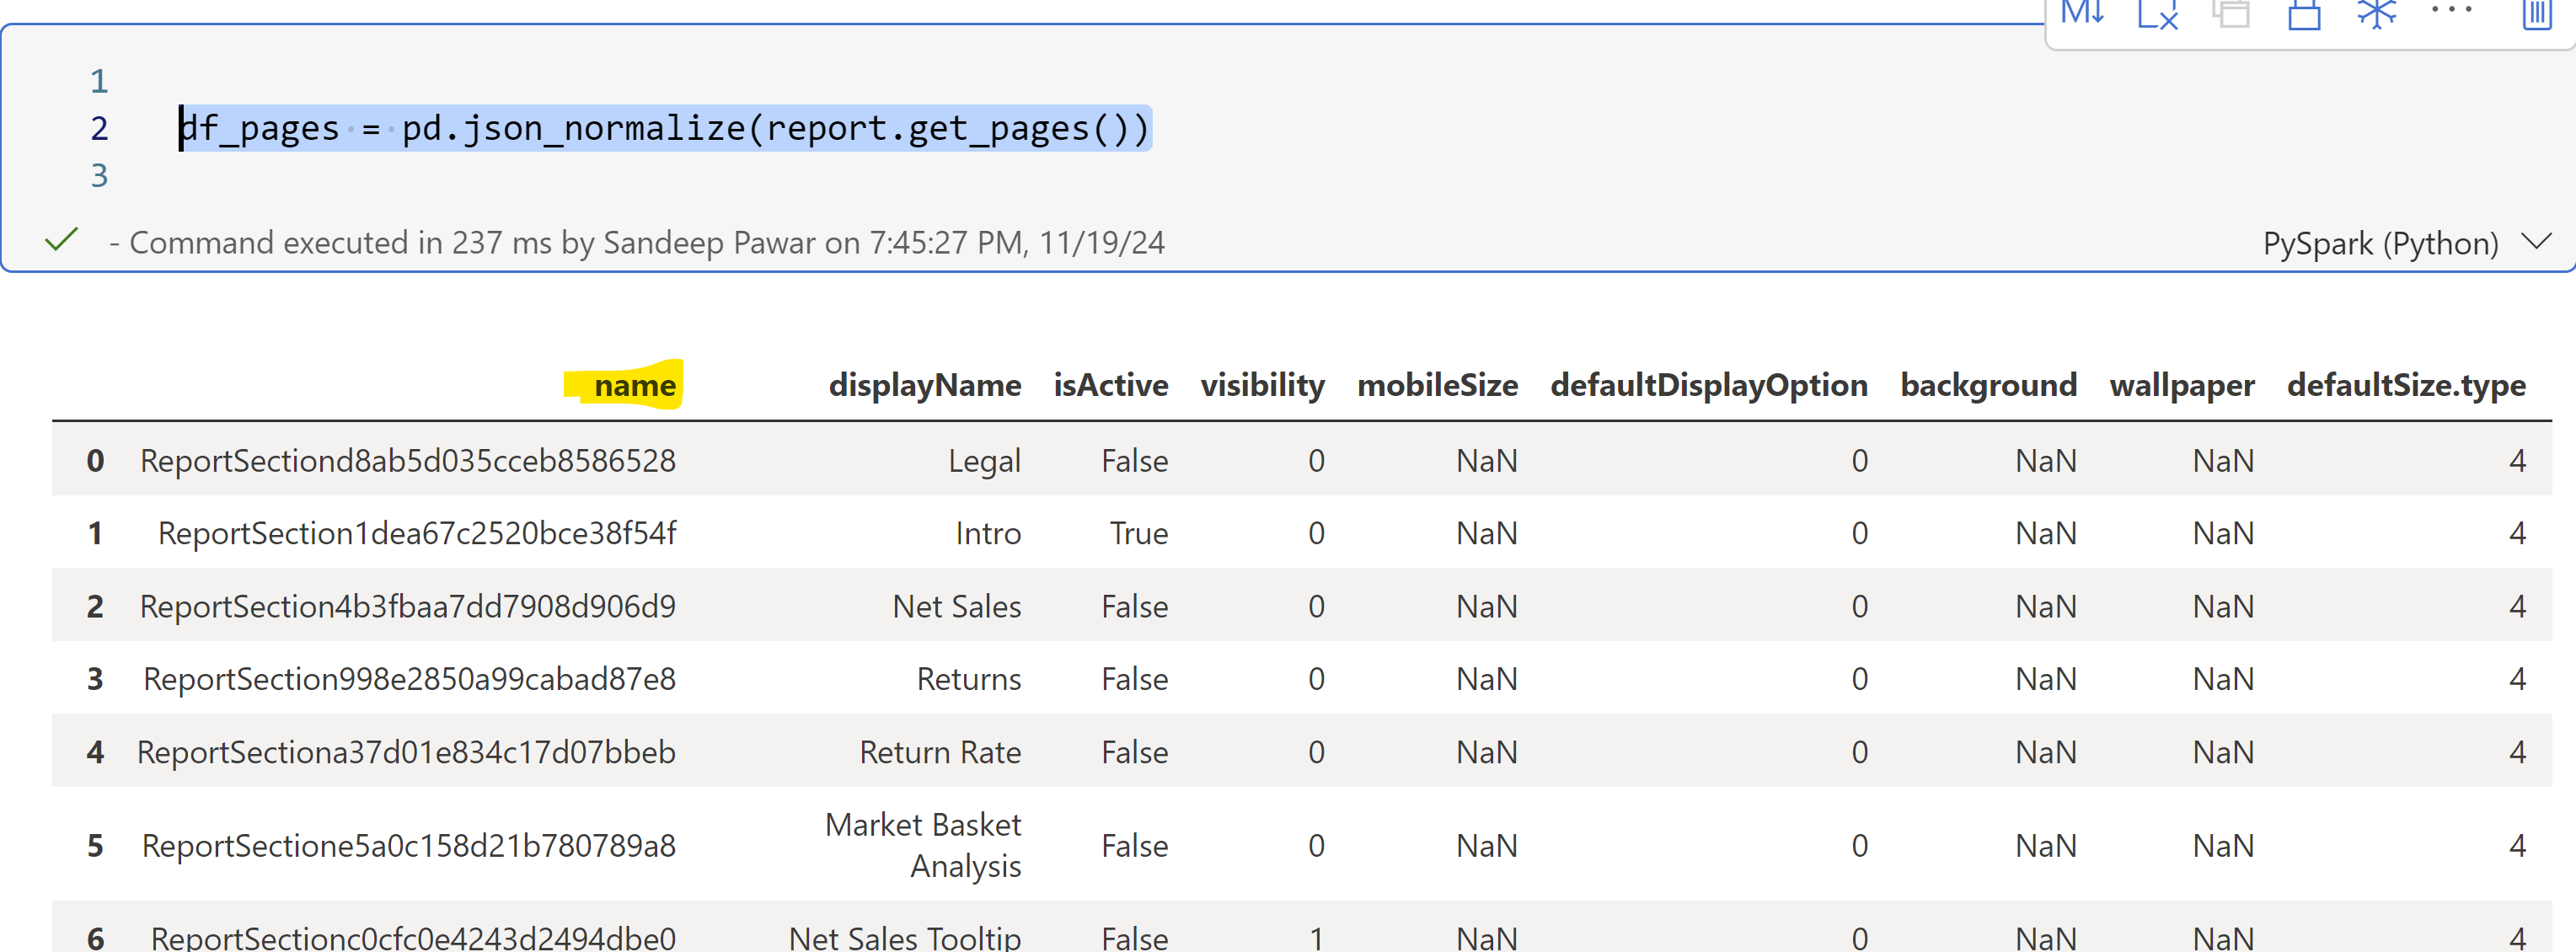
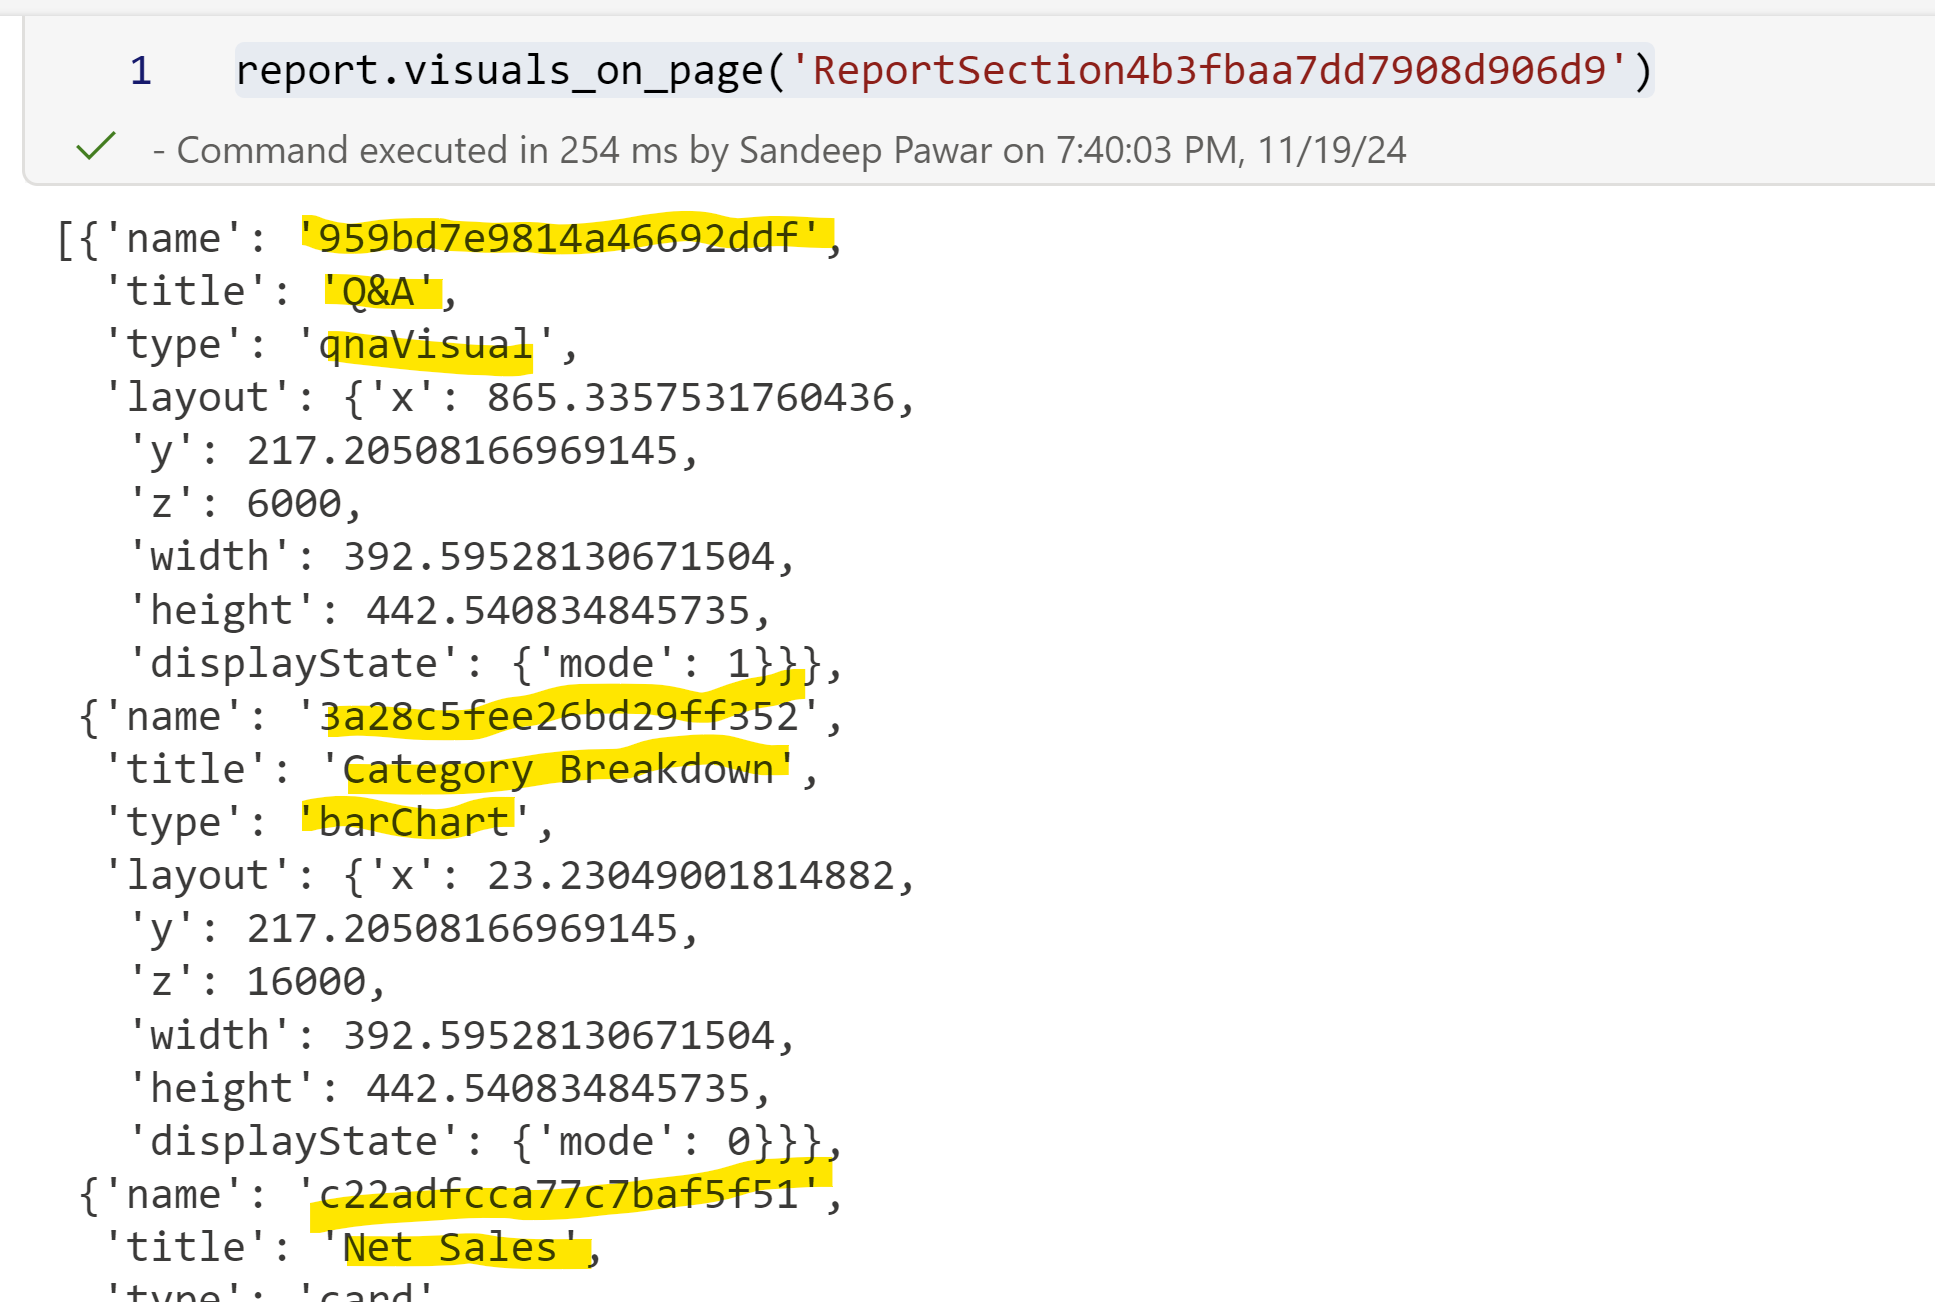
This returns list of all the pages in the report. Now we can iterate over all the pages and get the visuals on each page. For demonstration, I will show it one page:
report.visuals_on_page('ReportSection4b3fbaa7dd7908d906d9')
In the next blog, I will show how this can be used with Fabric Workspace Monitoring. Stay tuned !
About the author
Principal Program Manager, Microsoft Fabric CAT helping users and organizations build scalable, insightful, secure solutions. Blogs, opinions are my own and do not represent my employer.
Comments
Join the discussionHi, i have try this code, but when i run this code df_pages = pd.json_normalize(report.get_pages()) it shows an error like this : Power BI report is not embedded
Please help