📨Email Semantic Model BPA Report Using Semantic Link Labs
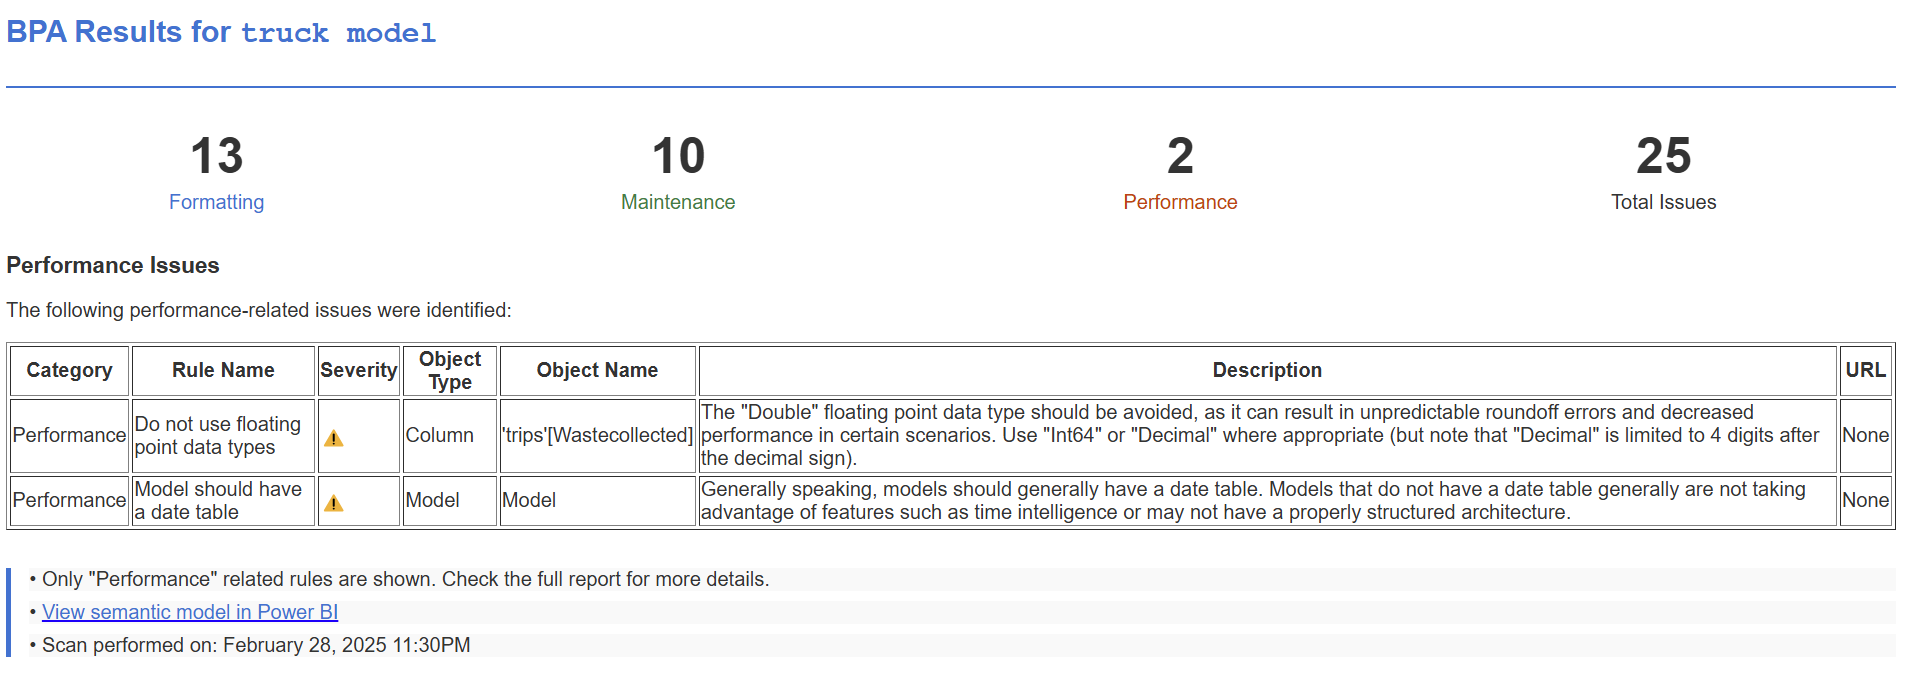
Semantic Link Labs’s new version 0.9.4 is out and the new functions and updates list is as long as this month’s Fabric updates ! Last version had many graph api functions. The send_email function has been updated to send HTML content. Below, with some help from Sonnet 3.7, I created an HTML body to send semantic model BPA in an email.
You will need to create service principal, add the credentials to Azure Key Vault and in the API permissions give the SP Mail.Send, User.Read, Mail.Read permissions. Take a look at this notebook for details. Change the HTML based on your requirements:
import sempy.fabric as fabric
from datetime import datetime
import pandas as pd
import sempy_labs as labs
from sempy_labs import admin, graph

# Configuration
model = "truck model" #semantic model name
workspaceid = fabric.get_workspace_id() #change as needed
datasetid = fabric.resolve_item_id(model)
subject = f"BPA Report for {model}"
to_recipients = ["sandeep@xxxxx.com"]
my_email = "fabricguru@fabric.xyz"
link = f"https://app.powerbi.com/groups/{workspaceid}/datasets/{datasetid}"
key_vault = "https://<keyvault>.vault.azure.net/"
scan_date = datetime.now().strftime("%B %d, %Y %I:%M%p")

# BPA results
all_bpa_results = labs.run_model_bpa(model, return_dataframe=True)
category_counts = all_bpa_results.groupby('Category')['Category'].count().to_dict()

# performance category only
bpa_html = all_bpa_results.query('Category == "Performance"').copy()

## I created the HTML using Sonnet 3.7
if bpa_html is not None and not bpa_html.empty:
    # Format severity icons - using .loc to avoid SettingWithCopyWarning
    if 'Severity' in bpa_html.columns:
        bpa_html.loc[bpa_html['Severity'] == '⚠', 'Severity'] = '<span style="color:#FF8C00; font-size:16px;">⚠</span>'
        bpa_html.loc[bpa_html['Severity'] == 'ℹ', 'Severity'] = '<span style="color:#0078D4; font-size:16px;">ℹ</span>'

    # Convert DataFrame to HTML table
    html_table = bpa_html.to_html(index=False, escape=False, classes='bpa-table')

    # Get count values (use actual values from category_counts or defaults if not present)
    formatting_count = category_counts.get('Formatting', 0)
    maintenance_count = category_counts.get('Maintenance', 0)
    performance_count = category_counts.get('Performance', 0)
    total_count = sum(category_counts.values())

    # Create HTML for KPI stats using a centered layout with colors
    kpi_html = f"""
    <div class="kpi-metrics">
        <table class="kpi-table">
            <tr>
                <td class="kpi-number">{formatting_count}</td>
                <td class="kpi-number">{maintenance_count}</td>
                <td class="kpi-number">{performance_count}</td>
                <td class="kpi-number">{total_count}</td>
            </tr>
            <tr>
                <td class="kpi-label" style="color: #0078D4;">Formatting</td>
                <td class="kpi-label" style="color: #107c41;">Maintenance</td>
                <td class="kpi-label" style="color: #d83b01;">Performance</td>
                <td class="kpi-label">Total Issues</td>
            </tr>
        </table>
    </div>
    """

    styled_html = f"""
    <!DOCTYPE html>
    <html>
    <head>
        <style>
            body {{
                font-family: Arial, sans-serif;
                color: #333333;
                line-height: 1.6;
                max-width: 900px;
                margin: 0 auto;
                padding: 20px;
            }}
            h2 {{
                color: #0078D4;
                border-bottom: 2px solid #0078D4;
                padding-bottom: 8px;
                margin-bottom: 20px;
            }}
            .kpi-metrics {{
                width: 100%;
                margin: 30px 0;
            }}
            .kpi-table {{
                width: 100%;
                border-collapse: collapse;
                text-align: center;
            }}
            .kpi-number {{
                font-size: 40px;
                font-weight: bold;
                padding-bottom: 5px;
            }}
            .kpi-label {{
                font-size: 16px;
                padding-top: 0;
            }}
            .bpa-table {{
                border-collapse: collapse;
                width: 100%;
                margin-top: 20px;
                margin-bottom: 30px;
                box-shadow: 0 2px 5px rgba(0,0,0,0.1);
            }}
            .bpa-table th {{
                background-color: #0078D4;
                color: white;
                font-weight: bold;
                text-align: left;
                padding: 12px;
                border: 1px solid #ccc;
            }}
            .bpa-table td {{
                padding: 10px 12px;
                border: 1px solid #e0e0e0;
                vertical-align: top;
            }}
            .bpa-table tr:nth-child(even) {{
                background-color: #f5f5f5;
            }}
            .bpa-table tr:hover {{
                background-color: #f0f7ff;
            }}
            .model-label {{
                font-family: monospace;
            }}
            .notes-section {{
                background-color: #f9f9f9;
                border-left: 4px solid #0078D4;
                padding: 15px;
                margin-top: 30px;
                border-radius: 0 4px 4px 0;
            }}
            .note-item {{
                margin-bottom: 8px;
            }}
            .note-link {{
                color: #0078D4;
                text-decoration: none;
            }}
            .note-link:hover {{
                text-decoration: underline;
            }}
            .scan-date {{
                font-style: italic;
                color: #666;
            }}
            .section-title {{
                margin-top: 30px;
                font-size: 18px;
                font-weight: 600;
                color: #333;
            }}
        </style>
    </head>
    <body>
        <h2>BPA Results for <span class="model-label">truck model</span></h2>

        {kpi_html}

        <div class="section-title">Performance Issues</div>
        <p>The following performance-related issues were identified:</p>
        {html_table}

        <div class="notes-section">
            <div class="note-item">• Only "Performance" related rules are shown. Check the full report for more details.</div>
            <div class="note-item">• <a href="{link}" class="note-link">View semantic model in Power BI</a></div>
            <div class="note-item scan-date">• Scan performed on: {scan_date}</div>
        </div>
    </body>
    </html>
    """
else:
    styled_html = f"""
    <!DOCTYPE html>
    <html>
    <head>
        <style>
            body {{
                font-family: Arial, sans-serif;
                color: #333333;
                line-height: 1.6;
                max-width: 900px;
                margin: 0 auto;
                padding: 20px;
            }}
            h2 {{
                color: #0078D4;
                border-bottom: 2px solid #0078D4;
                padding-bottom: 8px;
            }}
            .empty-state {{
                text-align: center;
                padding: 40px;
                background-color: #f9f9f9;
                border-radius: 8px;
                margin: 30px 0;
            }}
            .model-label {{
                font-family: monospace;
            }}
        </style>
    </head>
    <body>
        <h2>BPA Results</h2>
        <div class="empty-state">
            <p>No BPA results are available for <span class="model-label">{model}</span> at this time.</p>
            <p>Check the model/code</p>
        </div>
    </body>
    </html>
    """

# email
with labs.service_principal_authentication(
    key_vault_uri=key_vault,
    key_vault_tenant_id="tenantid",
    key_vault_client_id="clientid",
    key_vault_client_secret="secret"):

    graph.send_mail(
        user=my_email,
        subject=subject,
        to_recipients=to_recipients,
        content=styled_html,
        content_type="HTML"
    )
You can use graph function to a TON of other things. Check out Semantic Link Labs’s documentation and release notes.
Thanks to Michael Kovalsky for implementing my request! Also thanks to my colleague Ian Santillan for his help.
About the author
Principal Program Manager, Microsoft Fabric CAT helping users and organizations build scalable, insightful, secure solutions. Blogs, opinions are my own and do not represent my employer.
Comments
Join the discussionNo comments yet. Be the first to comment.