Calculating and Reducing Power BI Dataset Size Using Semantic Link
Using Semantic Link v0.6 to find dataset optimization opportunities across workspaces
Principal Program Manager, Microsoft Fabric CAT helping users and organizations build scalable, insightful, secure solutions. Blogs, opinions are my own and do not represent my employer.
Semantic Link v0.6 is out and it has many new exciting additions to its growing list of list_* methods. Highlighted are some of the new methods. Install the latest version and check it out.
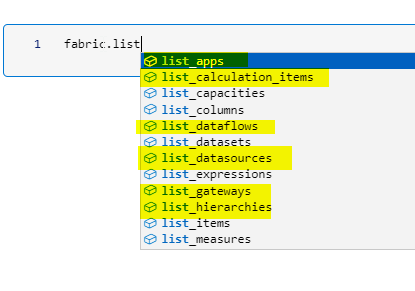
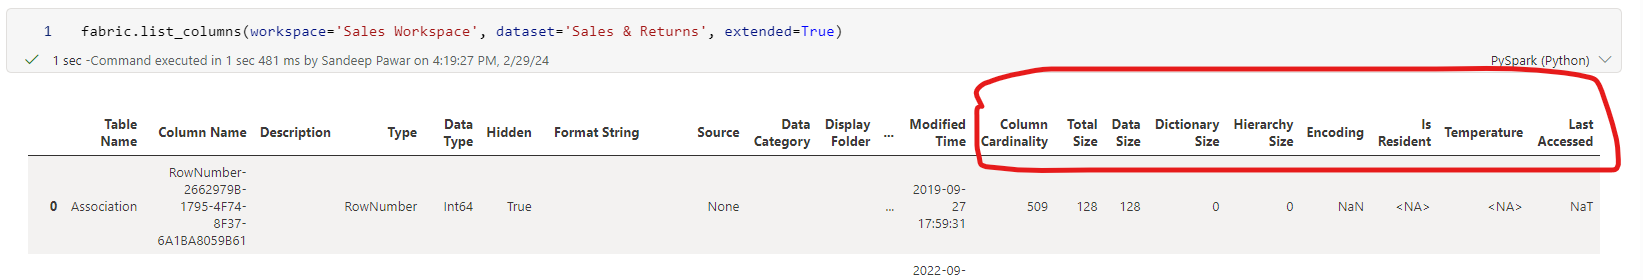
Some of the existing methods such as list_columns() have an additional parameter extended which returns more column information such as column cardinality, size, encoding and many more column properties. This allows users to get detailed information about the dataset and the columns.
I used this to create a function that calculates:
overall size of the semantic model based on column size. This includes data, dictionary and hierarchy size
number of tables in the model
%of size by calculated columns in the model. This can be used to identify datasets that heavily use calculated columns
%of size by calculated tables. We know that calculated tables do not compress as well as tables created using Power Query.
%of size by auto Datetime. Auto datetime can increase the size of the model significantly
%of size by floats, i.e. columns that have decimal data type. In Power BI, such columns can significantly increase the size of the model
%of size by column hierarchy. Column hierarchy size can increase for high cardinality columns. Turning off
IsAvailableInMDXfor such columns can lead to reduced size and faster refreshes. Watch this video by Marco to learn more.
All of this has already been available via VertiPaq Analyzer but one dataset at a time. Now with Semantic Link and Fabric notebooks, we can easily scan the entire tenant and obtain this information to :
Get an overall estimate of size of the model in memory
Identify cause of the bloated model size
Track and monitor change in size
Alert users proactively
Keep the capacity running efficiently
Below function:
Finds active capacities in the tenant
Only Premium/Fabric workspaces are included in the analysis
By default, default semantic models are excluded but you can include them by setting
drop_default_datasets=FalseFor default semantic models, since XMLA endpoint is not available, size cannot be calculated
Code
%pip install semantic-link --q #install semantic-link v0.6

import sempy.fabric as fabric
import pandas as pd
import datetime


def analyze_model_size(drop_default_datasets=True):
    """
    Author : Sandeep Pawar |  fabric.guru  |  02-29-2024

    This function scans the active premium workspaces in the entire tenant and calculates the total column size
    of premium datasets (import and Direct Lake). The purpose of the function is to get the total column size and
    identify size reduction opportunities by calculating percentage of size occupied by calculated tables, calculated columns,
    auto datetime tables, columns with double data type and column hierarchy size.

    Note that user hierarchy and relationship size are not used in memory size calculation.

    args: drop_default_datasets=True
          set to False to drop default datasets from the final dataframe. Default is True.

    """

    def get_ds_size(workspace, dataset):
        all_columns = fabric.list_columns(workspace=workspace, dataset=dataset, extended=True)
        size = sum(all_columns["Total Size"])
        calc_cols = sum(all_columns[all_columns.Type == "Calculated"]["Total Size"])
        calc_tables = sum(all_columns.query('Type == "CalculatedTableColumn"')["Total Size"])
        auto_date = sum(all_columns[all_columns['Table Name'].str.startswith(("DateTableTemplate_", "LocalDateTable_"))]["Total Size"])
        float_cols = sum(all_columns.query('`Data Type` == "Double"')["Total Size"])
        hierarchy_size = sum(all_columns["Hierarchy Size"]) #column hierarchy size
        num_tables = all_columns["Table Name"].nunique()

        return size, calc_cols, calc_tables, auto_date, float_cols, hierarchy_size, num_tables

    #Get active capacities only
    active_capacities = fabric.list_capacities().query('State == "Active"')
    #Premium and Fabric workspaces
    ws = fabric.list_workspaces().query('`Is On Dedicated Capacity`==True')
    premium_workspaces = ws[ws['Capacity Id'].isin(list(active_capacities.Id))]
    datasets = pd.concat([fabric.list_datasets(ws).assign(workspace=ws) for ws in premium_workspaces['Name']], ignore_index=True)
    col_list = ['total_columnsize_MB', 'pct_size_calculated_cols', 'pct_size_calculated_tables',
             'pct_size_autodatetime', 'pct_size_floats', 'pct_hierarchy_size','number_of_tables']
    catalog = datasets[["workspace", "Dataset Name"]].copy().assign(date = datetime.date.today())
    catalog[col_list] = pd.NA

    for i, row in catalog.iterrows():
        try:
            size, calc_cols, calc_tables, auto_date, float_cols, hierarchy_size, num_tables = get_ds_size(row["workspace"], row["Dataset Name"])
            catalog.loc[i, ['total_columnsize_MB', "pct_size_calculated_cols", 'pct_size_calculated_tables',
                            'pct_size_autodatetime', 'pct_size_floats', 'pct_hierarchy_size', 'number_of_tables']] = [
                round(size/(1024**2), 1), round(100 * (calc_cols / size), 1), round(100 * (calc_tables / size), 1),
                round(100 * (auto_date / size), 1), round(100 * (float_cols / size), 1), round(100 * (hierarchy_size / size), 1), int(num_tables)
            ]
        #Excpetion to handle default datasets which do not have XMLA endpoint
        except Exception:
            continue
    for col in col_list:
        catalog[col]=pd.to_numeric(catalog[col], errors='coerce')

    if drop_default_datasets:
        #default datasets will show NaN values. To include default, set drop_default_datasets=False
        catalog.dropna(inplace=True)

    catalog.sort_values(by=['total_columnsize_MB'], ascending=False, inplace=True)
    catalog.reset_index(drop=True, inplace=True)
    return catalog

df = analyze_model_size()
df
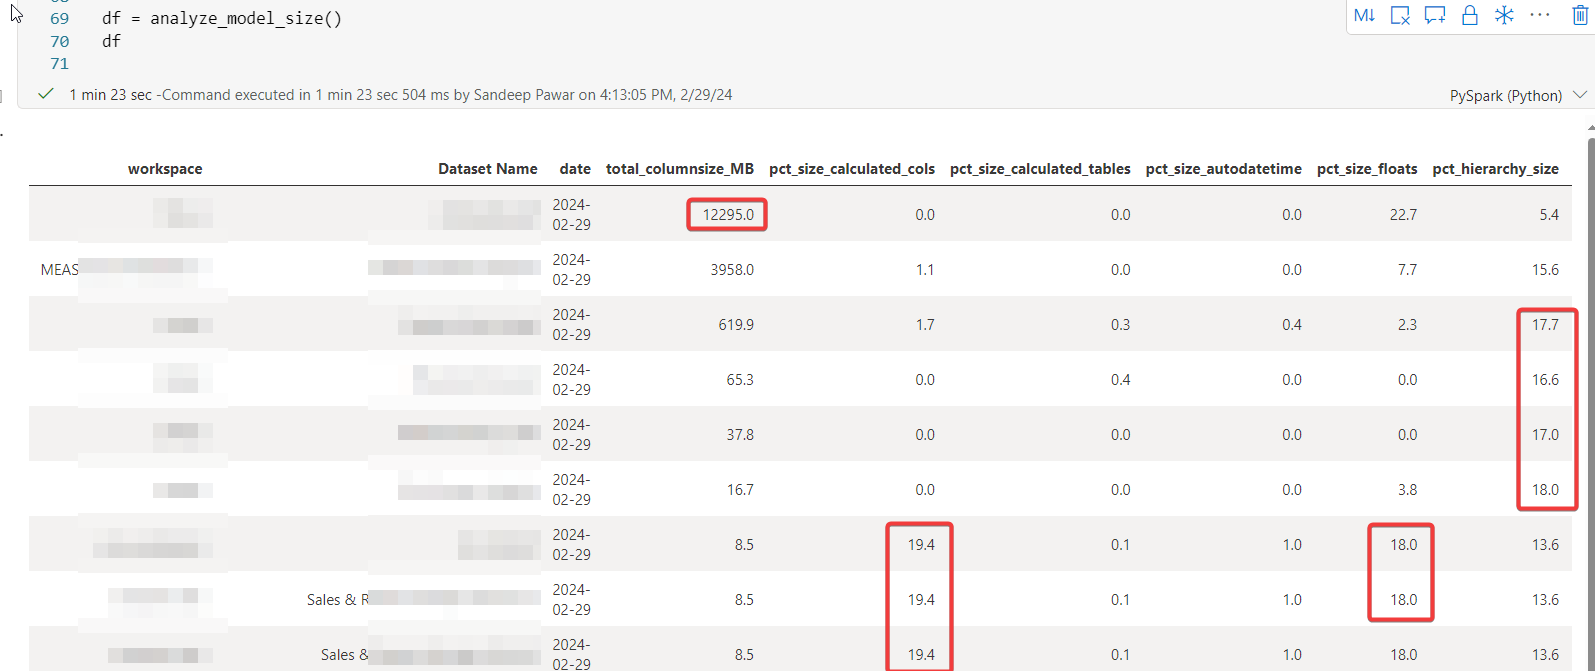
In the example above, I can right away get the idea about the size of the semantic model and factors that are potentially contributing to the size of the model. There can be other reasons as well but this will help identify the problematic models quickly and direct the optimization efforts.
Summary Report
from IPython.display import display, HTML

df = analyze_model_size()
df2  = (df
        .groupby('workspace')
        .agg(Number_of_Datasets=('Dataset Name', 'count'),
        Estimated_Size_MB=('total_columnsize_MB', 'sum'))
       .sort_values('Estimated_Size_MB', ascending=False)
        )

def summarize_model(dfs_dict):
    """
    Displays dataframes in tabs in the notebook

    Parameters:
    - dfs_dict: Dictionary with tab titles as keys and pandas DataFrames as values.
    """
    # Basic styles for the tabs and tab content
    styles = """
    <style>
        .tab { overflow: hidden; border: 1px solid #ccc; background-color: #f1f1f1; }
        .tab button { background-color: inherit; float: left; border: none; outline: none; cursor: pointer; padding: 14px 16px; transition: 0.3s; }
        .tab button:hover { background-color: #ddd; }
        .tab button.active { background-color: #ccc; }
        .tabcontent { display: none; padding: 6px 12px; border: 1px solid #ccc; border-top: none; }
    </style>
    """
    # JavaScript for tab functionality
    script = """
    <script>
    function openTab(evt, tabName) {
        var i, tabcontent, tablinks;
        tabcontent = document.getElementsByClassName("tabcontent");
        for (i = 0; i < tabcontent.length; i++) {
            tabcontent[i].style.display = "none";
        }
        tablinks = document.getElementsByClassName("tablinks");
        for (i = 0; i < tablinks.length; i++) {
            tablinks[i].className = tablinks[i].className.replace(" active", "");
        }
        document.getElementById(tabName).style.display = "block";
        evt.currentTarget.className += " active";
    }
    </script>
    """
    # HTML for tabs
    tab_html = '<div class="tab">'
    content_html = ''
    for i, (title, df) in enumerate(dfs_dict.items()):
        tab_id = f"tab{i}"
        tab_html += f'<button class="tablinks" onclick="openTab(event, \'{tab_id}\')">{title}</button>'
        content_html += f'<div id="{tab_id}" class="tabcontent"><h3>{title}</h3>{df.to_html()}</div>'
    tab_html += '</div>'

    # Display the tabs, tab contents, and run the script
    display(HTML(styles + tab_html + content_html + script))
    # Default to open the first tab
    display(HTML("<script>document.getElementsByClassName('tablinks')[0].click();</script>"))

#define the dictionary with {"Tab name":df}
df_dict = {
    "Details":df,
    "Workspace Summary":df2,
    "Top 10 By Column Size": df.nlargest(10, 'total_columnsize_MB'),
    "Top 10 By Calculated Columns": df.nlargest(10, 'pct_size_calculated_cols'),
    "Top 10 By Calculated Columns": df.nlargest(10, 'pct_size_calculated_tables'),
    "Top 10 By Column Hierarchy Size": df.nlargest(10, 'pct_hierarchy_size'),
    "Top 10 By Auto DateTime": df.nlargest(10, 'pct_size_autodatetime')

        }
summarize_model(df_dict)
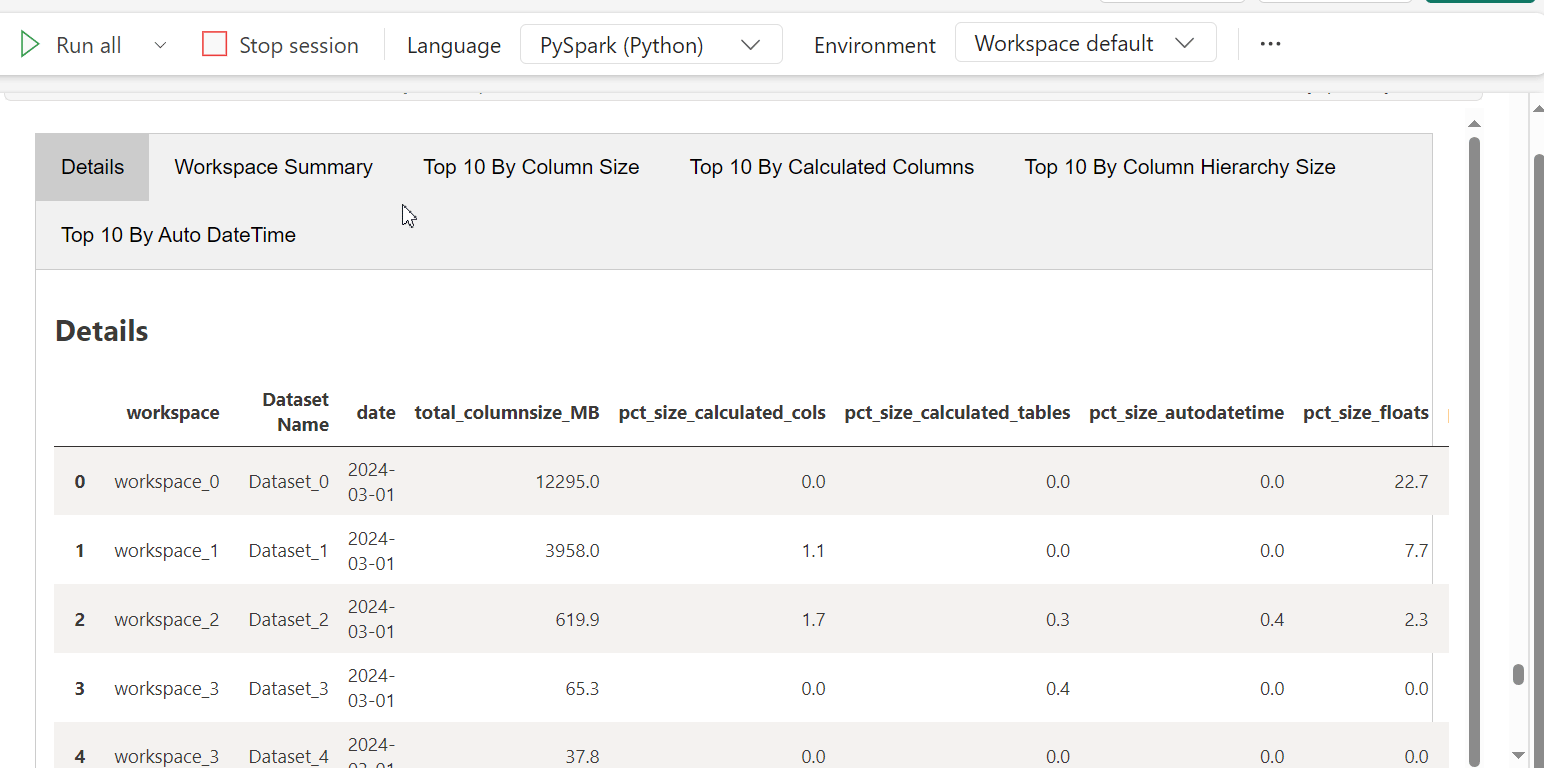
The tabbed summary report shows the overall summary as well as the datasets sorted by different criteria to help users get started.
This is not a replacement of existing methods or tools to track and optimize the semantic models. For example, Measure Killer provides very detailed information about a model. Consider this as another tool in your tool chest to programmatically identify optimization opportunities.
If you think of any additional metrics I should include, please let me know.
I want to thank Markus Cozowicz and Michael Kovalsky at Microsoft for their help.