Fabric Semantic Link has finally been announced and is available for everyone to use. If you know me and have followed my blogs/presentations, you know that I am very passionate about data science, Power BI, notebooks and Python. If you ever meet with product PMs from Microsoft, invariably they will ask you "If you had a magic wand, what feature would you want?" In all of my interactions with them in the last two years, my answer was - something that would allow me to easily access the Power BI semantic model using Python/R/spark in a notebook so I could enrich/augment Power BI reports with data science insights & solutions. Well, they listened, took notes and made that wish into a reality. Semantic Link does all of the above things plus more. Before I explain what Semantic Link is, allow me to set the stage first. I will explain the need, use cases and some of the Semantic Link features. Hopefully, at the end of the blog, you will be as excited as I am.
Overview
If you use the Microsoft data stack, the data scientists primarily use Azure Databricks or Azure Machine Learning to develop and deploy their data science solutions. A typical data analyst or Power BI developer rarely has access to those platforms and has no visibility on what data was used, how the models were created and what assumptions went into creating the ML models. They both operate in their silos and unfortunately, I have experienced the issues it causes firsthand.
Before Fabric

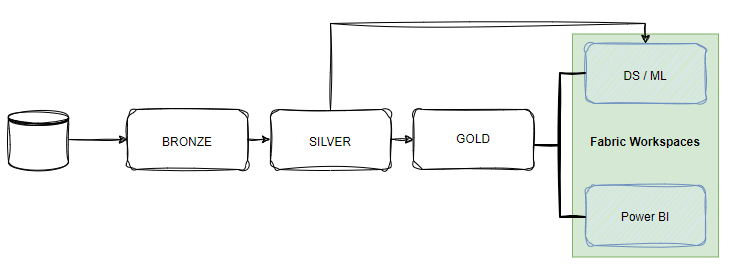
With Fabric
Microsoft solved that challenge by creating one single SaaS product, Microsoft Fabric, where the data scientists, data engineers and Power BI developers can all collaborate and access the same data & items thanks to OneLake. However, it only solved part of the challenge.
Consider the following scenarios:
As a data scientist, you are working on developing a hierarchical sales forecasting model for all product SKUs. You utilize the table from the gold layer, the same as the BI developer, to calculate net sales for all products, create features, and develop an accurate model that the BI developer can incorporate into their report. However, if you have experience with BI projects, you know that calculating the total sales amount is often not so straightforward. In your DAX measure, you will likely include business logic to exclude internal customers, specific departments, and accounts that are not revenue accounts, as well as potentially excluding adjustments and returns. Additionally, you may have visuals where extra filters are applied based on user requirements. If the logic used in the BI report/visual differs from what the data scientist used to train the model, the advanced model will still produce incorrect predictions, regardless of its sophistication. This issue becomes even more problematic if you have a large team with multiple departments and each member defines these measures/features differently.
Let's assume that instead, they collaborate during development and both use the exact same business logic to calculate the sales amount. Now, the data generation process and assumptions align, and everything is good. They move on to their next projects, and six months later, someone takes over this project. Business conditions and requirements have changed, and the new BI developer updates the DAX measures, but the data scientist isn't informed of the change. Now, there is a disconnect between the two, which means the predictions are going to be incorrect again. The BI developer may inform the data scientist colleague about the change in metric definition, but there is no automated process to track if the DAX measure/semantic model has changed and alert data scientists or others of the change.
Let's continue with the example of building a sales forecasting machine learning model. As a Data Scientist, you will create several features to capture the signal and trend in the data. If you are not familiar with features, consider them as numerical representations of the data. For instance, to create a forecasting model for each SKU, you will typically calculate sales from previous days, weeks, months, etc. Data Scientists refer to these as "lags," while BI developers call them time intelligence calculations - WTD, MTD, QTD, Previous Day/Week/Month, etc., which are part of most BI reports. If the BI developer is going to create these measures, shouldn't the data scientist be able to reuse the same measures for consistency and efficiency, at least for rapid prototyping?
I have discussed and presented on several occasions (here and here) how I use notebooks to explore data in my Power BI report development workflow. I may not necessarily build a data science solution for a BI project but the notebooks help with ad-hoc exploration and can help identify insights that otherwise are almost impossible with just Power BI. The primary challenge in this workflow, however, is that I must redefine all the measures and calculations in the notebook using Python. Plus, any insights I find cannot be incorporated in the report.
These challenges arise because there has not been an easy way to use the semantic model defined in the Power BI dataset outside of Power BI. You can use the Power BI REST API or XMLA endpoint (I wrote about it here), but it is too tedious and has several limitations. All the rich business logic captured in the semantic layer through the dimensional model and DAX measures can not be utilized by data scientists and BI developers to build additional solutions - until now ! With Semantic Link, data scientists can now explore the semantic model using Python, PySpark, and SparkSQL in the Fabric Data Science experience. This enables seamless collaboration between data scientists and BI developers, offering full visibility into the semantic layer.
With Fabric Semantic Link

Semantic Link includes sempy Python library which can be used in Fabric notebook to access any Power BI dataset (i.e. semantic model), including all the relationships, data, measures, calculated columns, hierarchies, DMVs and execute DAX against the model in the notebooks using Python or spark. Let's take a simple example of how a data scientist will use this to understand more:
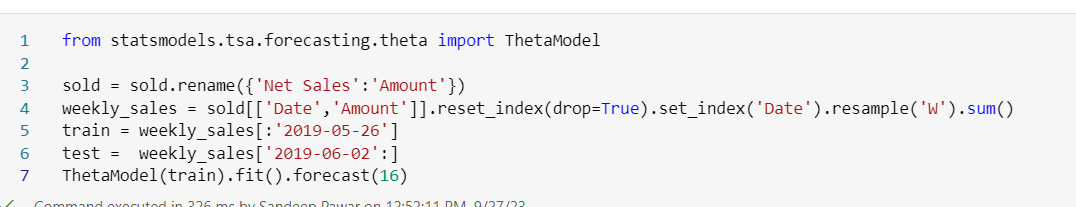
To continue with the previous example of forecasting, imagine I need to create a univariate forecast model and the predictions need to be used in a Power BI report. Instead of defining the revenue logic again, I can query the Power BI dataset directly which has the sales measure, build the training dataset to create the model, and save the predictions to the lakehouse.
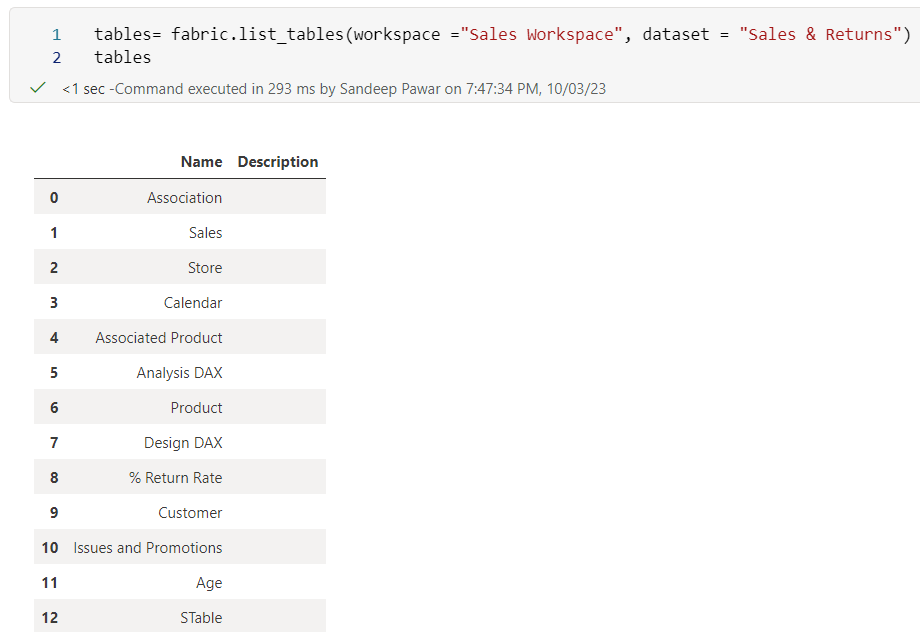
- List all the tables from Sales & Returns dataset in Sales Workspace:
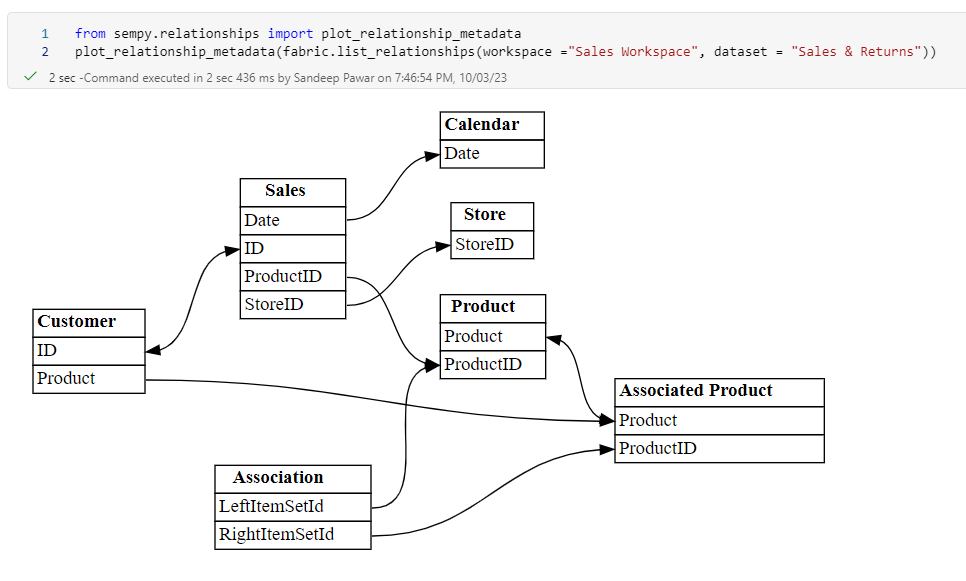
View relationships between the tables. From the relationship, I can see that we have a sales fact table and product & calendar dim tables. Two tables have many-to-many relationships.
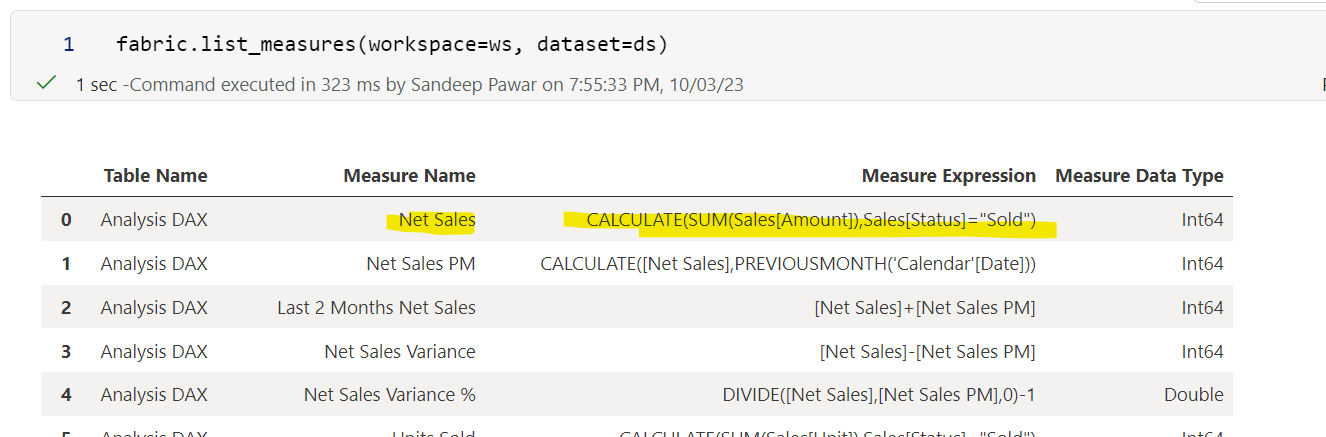
Next, I need to identify the measures in this dataset. I see "Net Sales" measure with its DAX
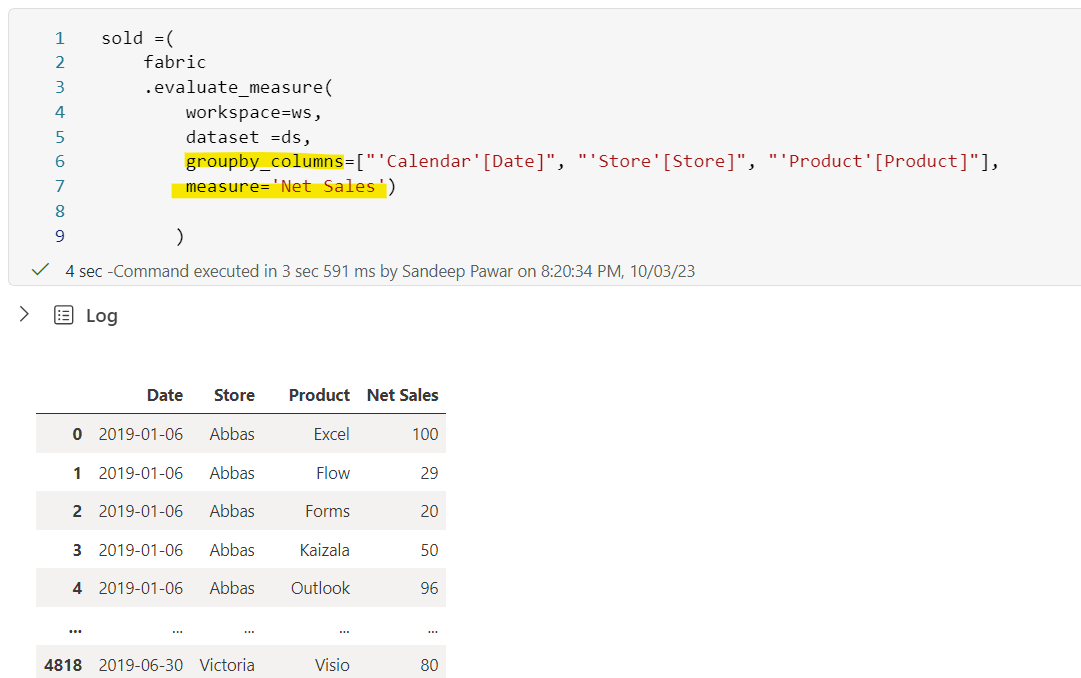
Now, I need to build the training set based on weekly sales so I will get the data I need from the dataset using evaluate_measure:
💡
Here I did not have to create a join between Calendar, Store, Product and Sales tables, unlike a pandas dataframe. I created a "FabricDataFrame" that behaves as a pandas dataframe but is aware of the semantic relationship among these tables and hence provides the aggregate based on the context- just like Power BI does. FabricDataFrame supports all pandas operations plus the semantic information, lineage and semantic functions.
Note in this case, I used the Python API because that's what I am familiar with as a data scientist. But if I knew DAX or the Power BI developer shared the DAX with me, I could have used that as well:

From here I can continue building the training dataset and build the model using pandas, spark, synapseml, sklearn with mlflow etc. just like any other data science project.

I can now evaluate the model, save it to the Fabric model registry and do scoring when required for it to be saved as a delta table for further use in a Power BI dataset.
This is a simple example but I was able to discover the semantic model and fully re-use it in the notebook using Semantic Link. I will share more detailed examples in the coming weeks so stay tuned.
What About Power BI Developers?
Buckle up ! Semantic Link has so many use cases for Power BI developers and data engineers that I think it's going to change our workflows and create many new solutions that were not possible before. Here are a few I thought of with examples:
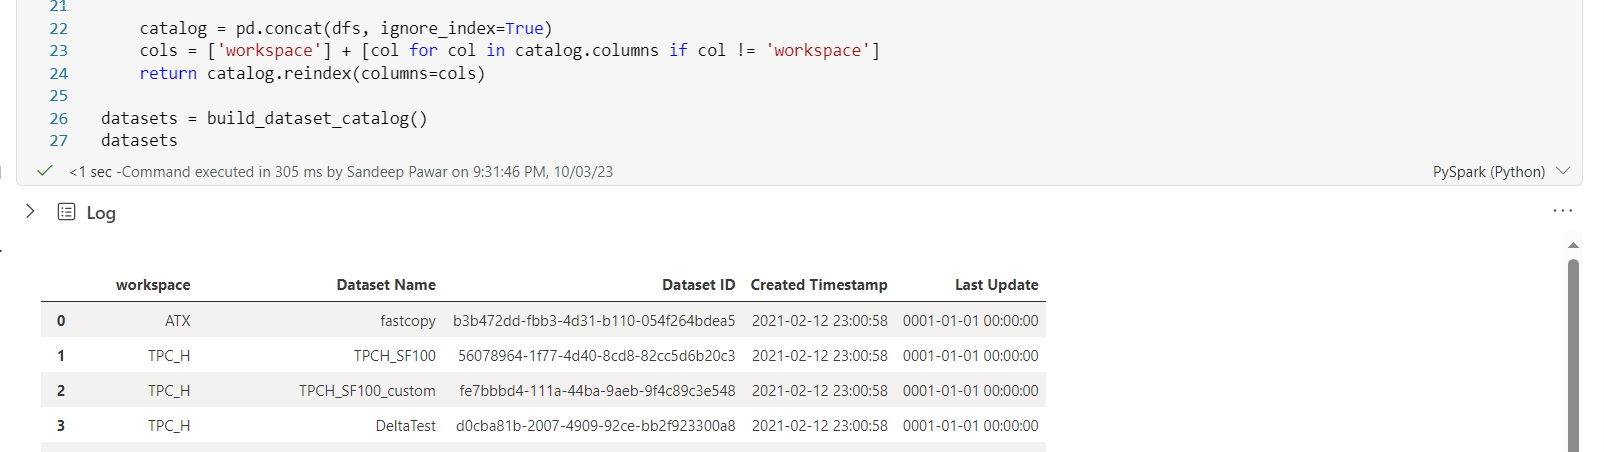
- Dataset Catalog: You can build a catalog of all available datasets as long as the datasets are in a Premium workspace in the same tenant. You can use sempy only in the Fabric notebook but the datasets can be in a Fabric, Premium or PPU workspace in the same tenant.
import requests
import pandas as pd
import sempy.fabric as fabric

def build_dataset_catalog():
    '''
    Sandeep Pawar | Fabric.guru
    Build dataset (semnatic model) catalog in Fabric
    '''
    url = "https://analysis.windows.net/powerbi/api"
    token = mssparkutils.credentials.getToken(url)
    headers = {"Authorization": "Bearer " + token}

    response = requests.get("https://api.powerbi.com/v1.0/myorg/groups", headers=headers)
    premium_workspaces = pd.DataFrame(response.json()['value']).query('isOnDedicatedCapacity==True')[["name", "id"]]

    dfs = [
        fabric.list_datasets(ws).assign(workspace=ws)
        for ws in premium_workspaces['name']
    ]

    catalog = pd.concat(dfs, ignore_index=True)
    cols = ['workspace'] + [col for col in catalog.columns if col != 'workspace']
    return catalog.reindex(columns=cols)

datasets = build_dataset_catalog()
datasets
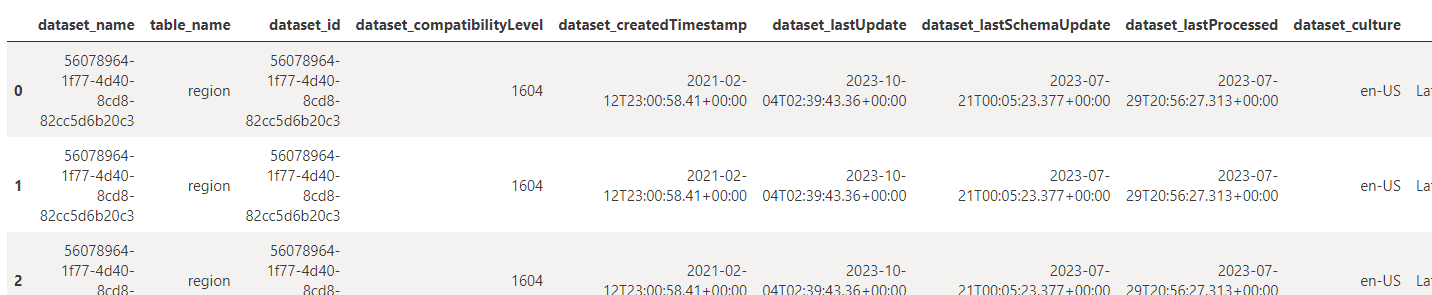
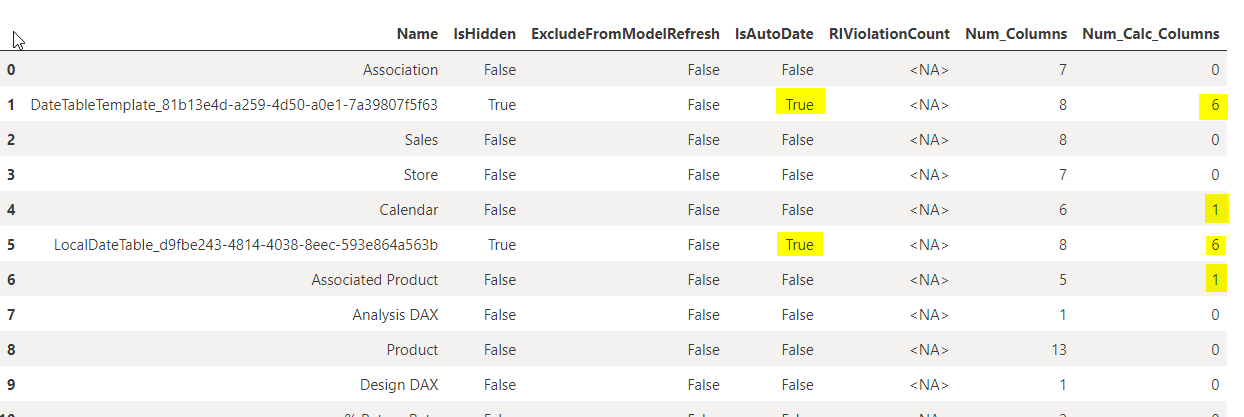
As an example, below I am executing three DMVs to get:
This can easily be extended further with other TOM properties to build BPA
import pandas as pd
import sempy.fabric as fabric
def pbi_table_report( workspace, dataset):
'''
Sandeep Pawar | Fabric.guru
Use sempy to execute DMVs and analyze tables for best practices
Ver: 0.2 | 2/16/2024
Warning : I haven not validated the DMVs yet, only for demo currently. I will update later.
'''
import warnings
warnings.filterwarnings("ignore", category=UserWarning)
table_list = (fabric
.evaluate_dax(
workspace=workspace, dataset=dataset,
dax_string="""select [ID], [Name], [IsHidden] from $SYSTEM.TMSCHEMA_TABLES"""
)
).assign(IsAutoDate=lambda x: x['Name'].str.startswith(('DateTableTemplate', 'LocalDateTable_'))).set_index('ID')
ir = (fabric
.evaluate_dax(
workspace=workspace, dataset=dataset,
dax_string="""select [Name],[RIViolationCount] from $SYSTEM.TMSCHEMA_TABLE_STORAGES"""
)
).assign(ID=lambda x: x['Name'].str.extract(r'\((\d+)\)$')).set_index('ID')
calc_cols = (fabric
.evaluate_dax(
workspace=workspace, dataset=dataset,
dax_string="""select [TableID],[Expression] from $SYSTEM.TMSCHEMA_COLUMNS"""
)
).groupby('TableID').agg(
Num_Columns=pd.NamedAgg(column='Expression', aggfunc='size'),
Num_Calc_Columns=pd.NamedAgg(column='Expression', aggfunc='count')
)
calc_cols.index.name = 'ID'
final = table_list.join(ir[['RIViolationCount']]).join(calc_cols).reset_index(drop=True)
return final
pbi_table_report( workspace = ws, dataset = ds)
Metric Report: You can query any measure from any Premium dataset you have access to. So you can create delta tables that have KPIs from different datasets and show them on one single report ! Imagine if you could create an executive report that shows revenue trend from revenue dataset, marketing KPIs from another dataset etc., something not currently possible without using Dashboards (or composite models).
Customized CSV Extracts: No matter how good your Power BI report is, business users always want CSV extracts. If you have an existing table in the Power BI report, you can use the underlying DAX measure in the evaluate_measure or evaluate_dax method to retrieve that table and save the CSV file. The best part is unlike the Power BI report, you can change the column headers, add custom indentation to hierarchies, add color formatting however you want and save as pdf, Excel on a schedule to OneLake!
Dataset Quality: Use WAP (Write-Audit-Publish) pattern for business-critical datasets where you first publish a "Control Dataset", audit it using DMVs for RI violations, data types, nulls and other data quality issues and then publish/refresh the actual dataset after the audit has passed. sempy is going to change how we do DataOps for Power BI.
Data Quality/Validation: Similarly, you can use great-expectations or pydeeque to validate datasets against the source or gold tables by following the same "Control Dataset" approach. DAX validation can also be performed in the same way. Read more about it here.
%[https://youtu.be/XZAff4SG_9c?si=OkCgi0qKW2ZE1FHJ]
Pre-Warming Direct Lake Dataset: I alluded to this when I wrote a blog post on how sempy can be used to pre-warm a Direct Lake dataset. Just as I showed above, you can query a set of columns using sempy right after refreshing the dataset in the pipeline so the users can get warm cache import-like performance.
Calculated Columns in Direct Lake: Using the "Control Dataset" approach, you can use the DAX measures to add calculated columns to a direct lake (or import) dataset right in the source, something currently not possible.
Get Dataset Size: As far as I know, currently, there is no programmatic way to get the size of a dataset in memory. You either have to use the metrics app or VertiPaq Analyzer. With sempy you can query the DMVs and get an approximate size of the datasets in all the workspace. I will publish a blog on this.
Metric Store: I am not a metric store expert but I can see a central BI team creating wrappers, functions, APIs to easily access the business KPIs, similar to Malloy. Business users can call these functions to quickly get the KPIs in a notebook and allow ad-hoc analysis without any knowledge of DAX or Power BI. If you have experience with Malloy, I would love to learn more.
Data Wrangler: If you are not familiar with Python, you can use Data Wrangler to work with a FabricDataFrame similar to pandas dataframes to perform pandas operations & methods. Data Wrangler doesn't perform semantic-link operations.
Data Apps: This is not supported and is not a feature. But, I can imagine in the future the data scientists can pull data from the Power BI dataset, enrich it with additional insights and publish a data app using streamlit, panel, Shiny etc. to Power BI Apps for business users to consume. This will open up Fabric to many users who are not familiar with Power BI but want to develop & publish data apps using open-source tools they know.
Here is a list of my blogs related to Semantic Link: https://fabric.guru/tag/semantic-link
These are just a few use cases. I am excited to see how everyone uses it in their workflow. There is more to Semantic Link than just sempy. My goal was to discuss and showcase some of the use cases and what's possible.
Congratulations to the product and engineering team on this awesome feature and I am looking forward to using it in my projects.
Notes
You need Fabric capacity to use Semantic Link and the dataset needs to be in a Premium/Fabric workspace
Remember that the goal is not to extract all data from a Power BI dataset and build another dataset. Your published report should be built using the source data. Semantic Link should be used to enrich/augment to create a "diamond layer" instead.
Unlike Power BI REST API, Semantic Link does not have any row limitation (except Spark SQL connector but that may change)
Semantic Link respects OLS/RLS
Semantic Link is still in public preview and some of the methods may be experimental.
References: