Using runMultiple To Orchestrate Notebook Execution in Microsoft Fabric
Using mssparkutils.notebook.runMultiple() to parallelize notebook execution
Principal Program Manager, Microsoft Fabric CAT helping users and organizations build scalable, insightful, secure solutions. Blogs, opinions are my own and do not represent my employer.
Using runMultiple in MicrosoftFabric notebook isn't new. It was announced, I think, at MS Ignite in November 2023. I tested it and worked beautifully. But the Notebooks team has been quietly adding great features to it and I wanted to show some of those. I want to thank Jene Zhang, Fang Zhang and Yi Lin from the Fabric Notebooks team for answering my questions.
The notebook class in mssparkutils has two methods to run notebooks - run and runMultiple . run allows you to trigger a notebook run for one single notebook. Mim wrote a nice blog to show how to use it and its usefulness.
runMultiple , on the other hand, allows you to create a Direct Acyclic Graph (DAG) of notebooks to execute notebooks in parallel and in specified order, similar to a pipeline run except in a notebook. The advantages here are that you can:
programmatically define the execution order
run notebooks in parallel or in squence
define dependencies between notebook runs
efficient use of the compute resources as it will use the compute of the orchestrating notebook
Depending on the F SKU and the node size, you may get
TooManyRequestsForCapacityerror if you run multiple notebooks at the same time because of concurrency limits. SincerunMultipleuses the same compute, you can mitigate this error. Advancing Analytics has an excellent blog that goes in-depth into this. My colleague Will Crayger also has also researched this topic and summarized his findings here.
Here is how you use it:
Create a DAG which is basically a json object with defined parameters. Use
mssparkutils.notebook.help("runMultiple")to learn about the API and the argumentsCreate a orchtration notebook to run all the DAG
There are quite a few additions to this method but a couple I would like to point out:
It now plots the DAG to show the execution order and the dependencies
You can monitor the progress of the execution interactively as the notebooks are being executed
You can alter the type and size of the DAG graph. As mentioned above, this is still under development and may change at any point. Keep an eye on the updates.
Example:
I have 9 notebooks in my pipeline:
4 extraction notebooks (2 dims and 2 facts for example purposes)
Each notebook has parameters defined (using toggle parameter)
extraction notebooks do not have any dependencies
I create 2 dim tables which depend on the dim extraction notebooks
The 2 facts are loaded after the successful extraction of fact data and after the dim tables are created
A semantic model is dependent on successful execution of all the above notebook and is refreshed after the dims and facts table created
Below is the DAG I created to capture this logic:
DAG = {
    "activities": [
        {
            "name": "extract_customers",
            "path": "extract_customers",
            "timeoutPerCellInSeconds": 120,
            "args": {"rows": 1000},
        },
        {
            "name": "extract_products",
            "path": "extract_products",
            "timeoutPerCellInSeconds": 120,
            "args": {"rows": 5000},
        },
        {
            "name": "extract_offers",
            "path": "extract_offers",
            "timeoutPerCellInSeconds": 120,
            "args": {"rows": 1000},
        },
        {
            "name": "extract_leads",
            "path": "extract_leads",
            "timeoutPerCellInSeconds": 120,
            "args": {"rows": 100000},
        },
        {
            "name": "customer_table",
            "path": "customer_table",
            "timeoutPerCellInSeconds": 90,
            "retry": 1,
            "retryIntervalInSeconds": 10,
            "dependencies": ["extract_customers"]
        },
        {
            "name": "products_table",
            "path": "products_table",
            "timeoutPerCellInSeconds": 90,
            "retry": 1,
            "retryIntervalInSeconds": 10,
            "dependencies": ["extract_products"]
        },
                {
            "name": "leads_table",
            "path": "leads_table",
            "timeoutPerCellInSeconds": 90,
            "retry": 1,
            "retryIntervalInSeconds": 10,
            "dependencies": ["extract_leads","customer_table", "products_table"]
        },
           {
            "name": "offers_table",
            "path": "offers_table",
            "timeoutPerCellInSeconds": 90,
            "retry": 1,
            "retryIntervalInSeconds": 10,
            "dependencies": ["extract_offers","customer_table", "products_table"]
        },
                   {
            "name": "refresh_dataset",
            "path": "refresh_dataset",
            "timeoutPerCellInSeconds": 90,
            "retry": 1,
            "retryIntervalInSeconds": 10,
            "dependencies": ["customer_table","products_table","leads_table","offers_table"]
        }

    ],
    "timeoutInSeconds": 3600, # max 1 hour for the entire pipeline
    "concurrency": 5 # max 5 notebooks in parallel
}
Note that in the above example, I also defined the timeout for the entire pipeline and also the concurrency limit of no more than 5 notebooks can be run in parallel.
To run and visualize the DAG:
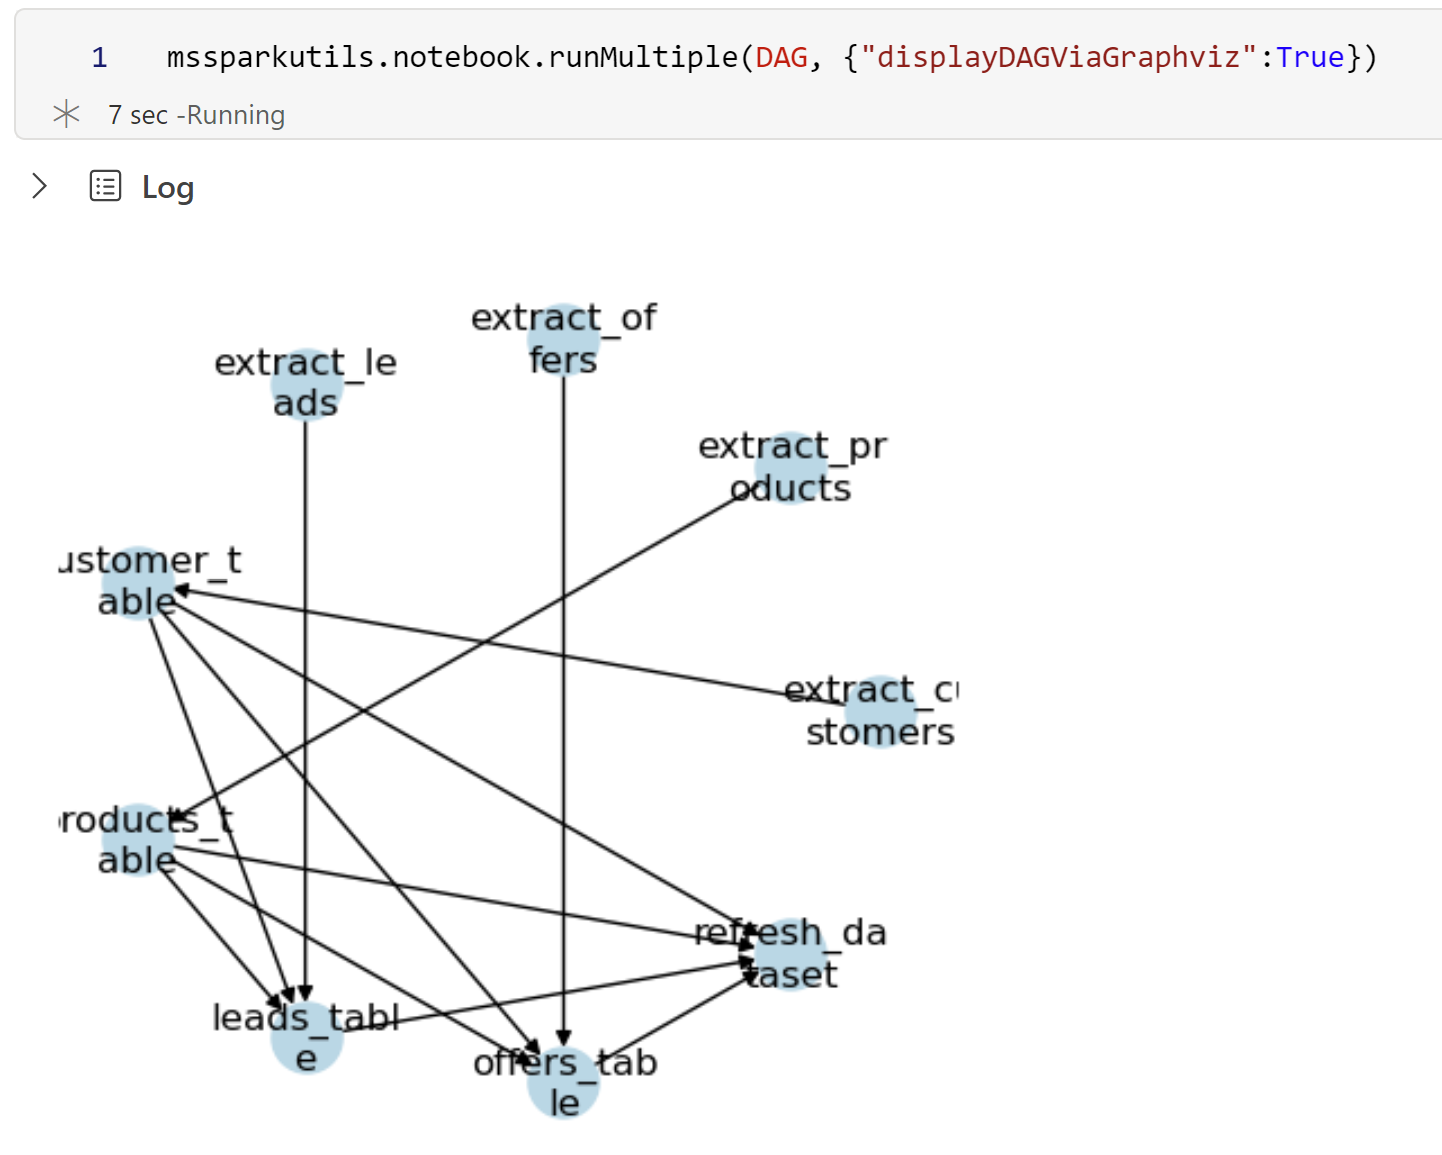
#check the API documentation for available DAG layouts, e.g. spring, circular, planar etc
mssparkutils.notebook.runMultiple(DAG, {"displayDAGViaGraphviz":True, "DAGLayout":"spectral", "DAGSize":11})
Progress bar :
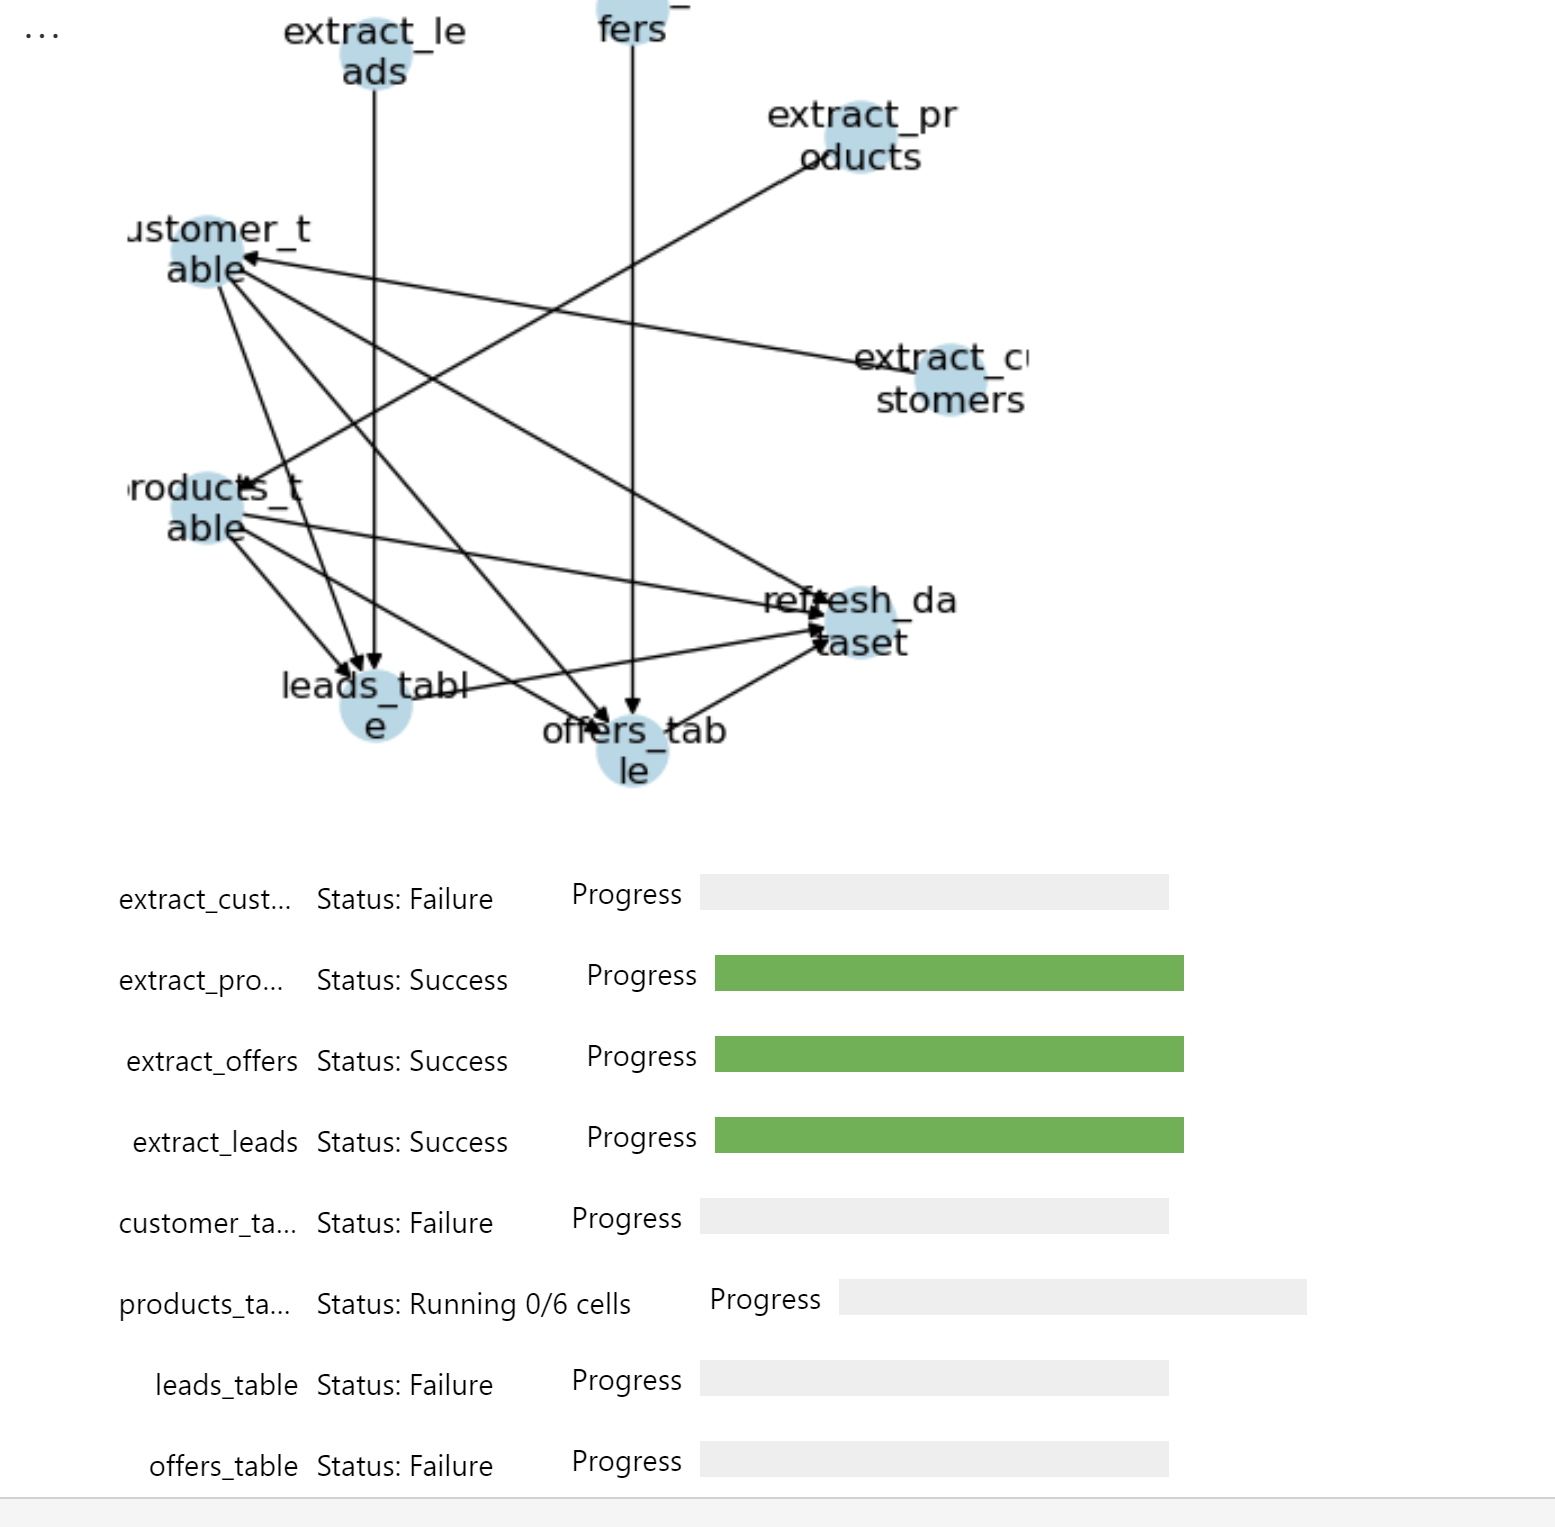
You can see the interactive progress bar as the notebooks are executed in the specified order, respecting the dependencies.
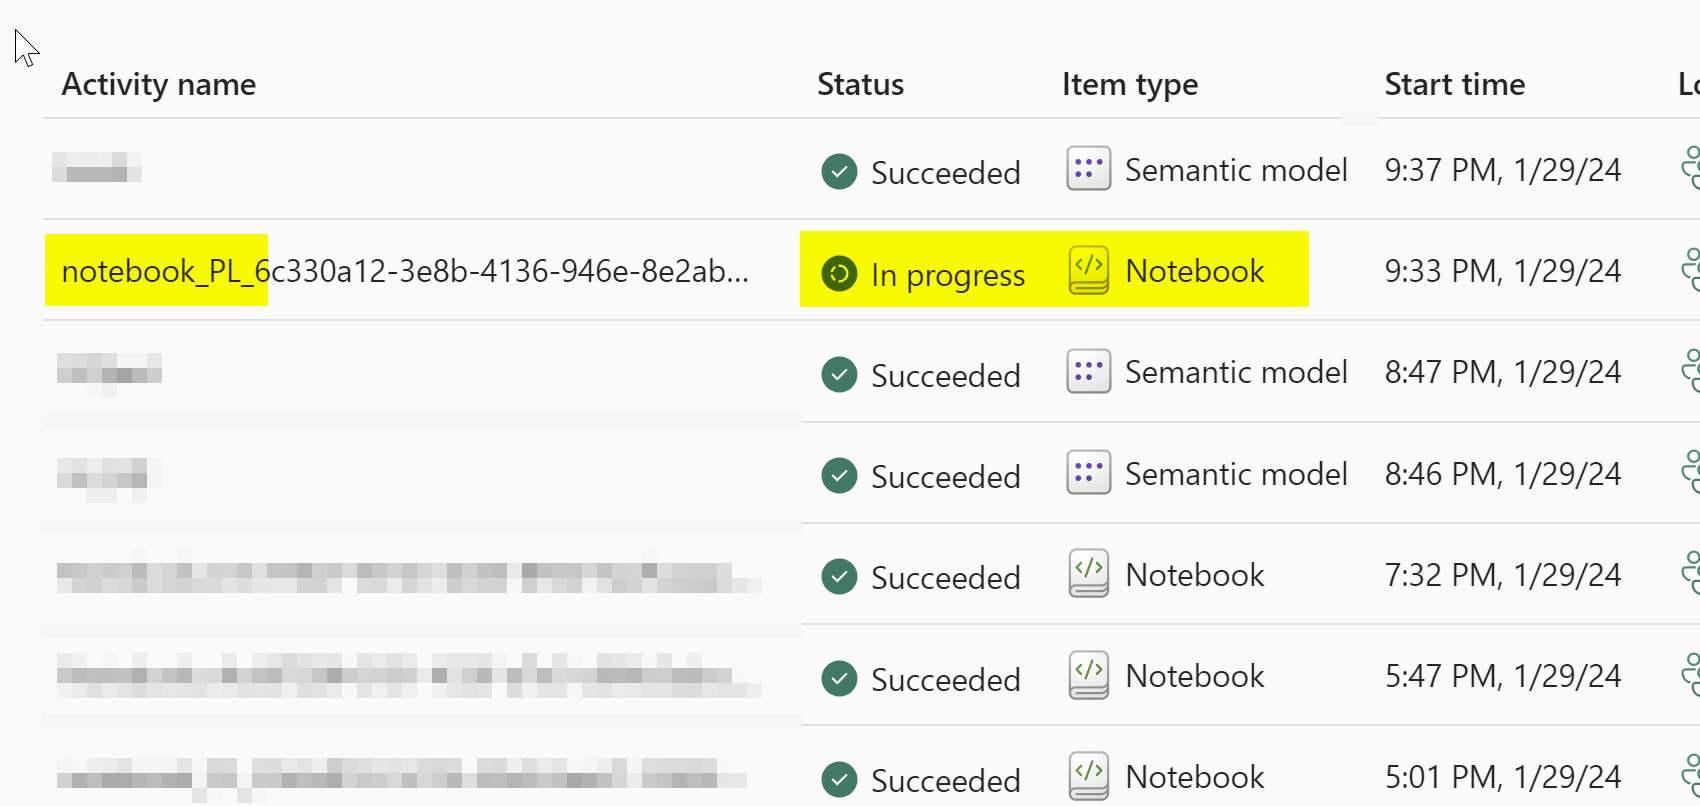
Although I have 9 notebooks in this pipeline, in the monitoring hub, I see only one that's being executed because all the notebooks share the compute of the orchestrating notebook.
The DAG viz shows the dependencies in a network graph. The arrows show how the notebooks are dependent on each other. While I like this, I created mine the way I like it :
from graphviz import Digraph

def generate_notebook_dependency_graph(json_data, show_legend=False, apply_color=False):
    """
    Sandeep Pawar  |  fabric.guru  | 1/30/24
    Visualize runMultiple DAG using GraphViz.
    """
    dot = Digraph(comment='Notebook Dependency Graph')
    dot.attr(rankdir='TB', size='10,10')
    dot.attr('node', shape='box', style='rounded', fontsize='12')

    if show_legend:
        with dot.subgraph(name='cluster_legend') as legend:
            legend.attr(label='Legend', fontsize='12', fontcolor='black', style='dashed')
            legend.node('L1', 'No Dependencies', style='filled', fillcolor='lightgreen', rank='max')
            legend.node('L2', 'One Dependency', style='filled', fillcolor='lightblue', rank='max')
            legend.node('L3', 'Multiple Dependencies', style='filled', fillcolor='lightyellow', rank='max')
            legend.node('L4', 'Args Present (in label)', rank='max')


    dot.attr('node', rank='', color='black')
    for notebook in json_data["activities"]:
        notebook_name = notebook['name']
        args = notebook.get('args', {})
        label = f"{notebook_name}"
        if args:
            label += f"\nArgs: {', '.join([f'{k}={v}' for k, v in args.items()])}"

        if apply_color:
            num_dependencies = len(notebook.get('dependencies', []))
            color = 'lightgreen' if num_dependencies == 0 else 'lightblue' if num_dependencies == 1 else 'lightyellow'
        else:
            color = 'white'

        dot.node(notebook_name, label, style='filled', fillcolor=color)

        for dependency in notebook.get('dependencies', []):
            dot.edge(dependency, notebook_name)


    display(dot)

generate_notebook_dependency_graph(DAG, show_legend=True, apply_color=True)
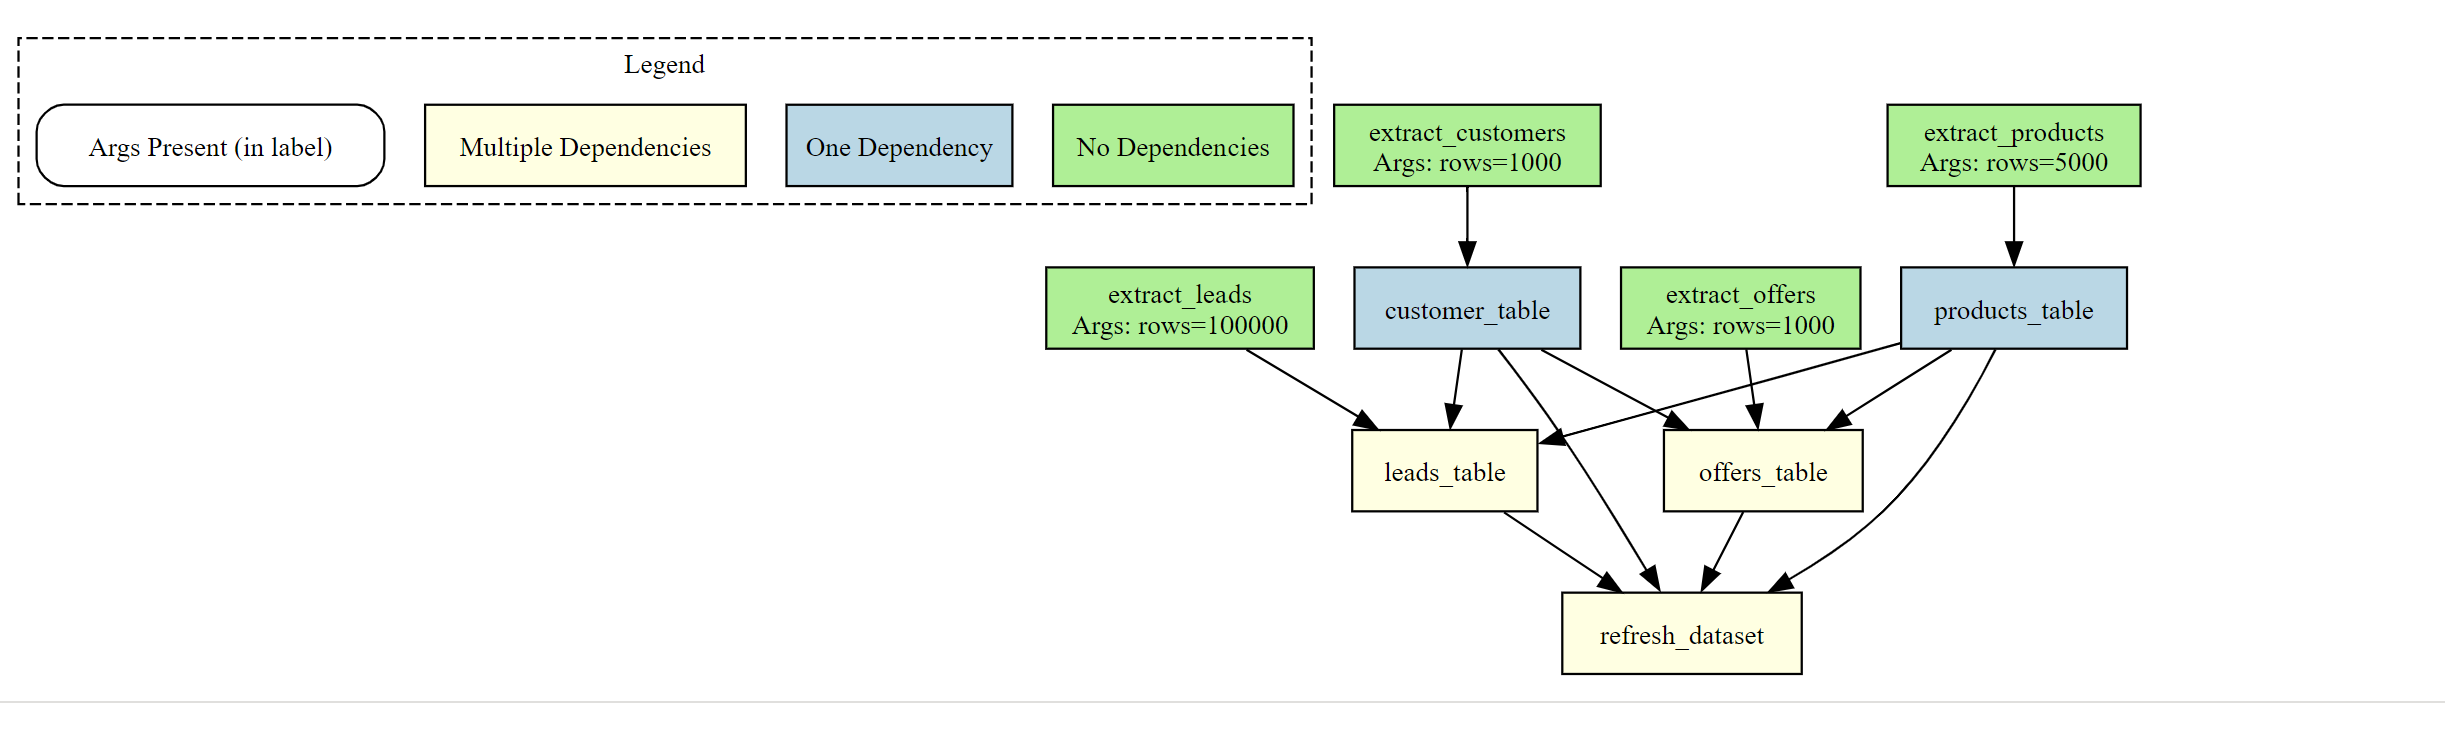
In the above DAG, I color coded the blocks and added them in a hierarchy to show how they are executed, which notebooks have parameters and which have dependencies. It would be nice to be able to build the DAG visually.
Current Limitations:
This feature is still in development
You can only refer to notebooks from the same workspace
Since the notebooks share the compute, all the notebooks must have the same environment.
You cannot create conditional branching based on exit value
Not so much a limitation but something to be aware of - you do not see the run history of the child notebooks in "All runs". e.g. if you need to see how long the individual notebooks ran and when etc., you cannot see that. You only see the run history of the orchestrating notebook. I am not sure how to use logging in this case.
Bonus Tips:
List of notebooks
When creating the DAG, you will need to see a list of notebooks. You can use below to get a list of notebooks in the workspace:
import sempy.fabric as fabric
notebooks = fabric.list_items().query("Type == 'Notebook'")
notebooks
Running notebooks from another workspace:
While mssparkutils "currently" doesn't support cross-workspace notebooks, you can use semantic-link to run notebooks from any workspace:
fabric.run_notebook_job("notebook_id", workspace="workspace_name")
I will update this blog as more features are added. In the meantime, if you have any suggestions/features, I encourage you to share feedback with Jene on Twitter.
Let me know if you would like the notebooks.