Building Insightful Analytical Solutions Using KQLMagic
This blog shows how to use KQL in Fabric notebook and what makes Fabric so awesome
Principal Program Manager, Microsoft Fabric CAT helping users and organizations build scalable, insightful, secure solutions. Blogs, opinions are my own and do not represent my employer.
A few months ago, I wrote a blog post about querying a KQL database in Fabric notebooks using the Python Kusto SDK. Although it works perfectly, my friend Alex Powers reminded me that kqlmagic can also be used in notebooks for a more ad hoc experience. I had previously used it in Azure Data Studio notebooks but had forgotten about it. In this blog post, I want to share kqlmagic and another Spark-based method for querying the Kusto database in notebooks. More importantly, I will provide a sample use case demonstrating how to build a rich analytical solution using these methods. Let's first examine the how, and then the why.
How
Using kqlmagic
kqlmagic allows you to combine Python and KQL for querying and visualizing data in notebooks. While you can use it in any IPython notebook, Fabric makes authentication to KQL cluster very easy. You can run KQL queries against your KQL database in the Python kernel by using the magic commands - %kql and %%kql . The result is a pandas dataframe which can then further be used in your analysis. The setup is very easy. We need to install the kqlmagic library, generate the authentication token and that's it.
Install kqlmagic and load the extension
 !pip install Kqlmagic --no-cache-dir --upgrade  --quiet

 reload_ext Kqlmagic
Generate authentication token :
Copy the Kustodb name and the cluster uri
   from notebookutils import mssparkutils
   ##replace with your uri and dbname
   kusto_uri = 'https://<db_name>.kusto.fabric.microsoft.com'
   kusto_dbname = '<dbname>'

   try:
       token = mssparkutils.credentials.getToken(kusto_uri)
       mssparkutils.credentials.isValidToken(token)
       print("valid token")
   except:
       "Not a valid kusto token"
Connect to the Kusto db
%kql kusto://code;cluster=kusto_uri;database=kusto_dbname -try_token={"tokenType":"bearer","accessToken":token}That's it ! We are now ready to query the above Kusto database in the Fabric notebook.
To run a query inline, use %kql and for multiline queries use %%kql
%kql StormEvents | summarize count() by State | sort by count_ | limit 10%%kql StormEvents | summarize count() by State | sort by count_ | limit 10 | render columnchart title='Top 10 States by Storm Event count'This will generate a pandas dataframe that you can use for further analysis.
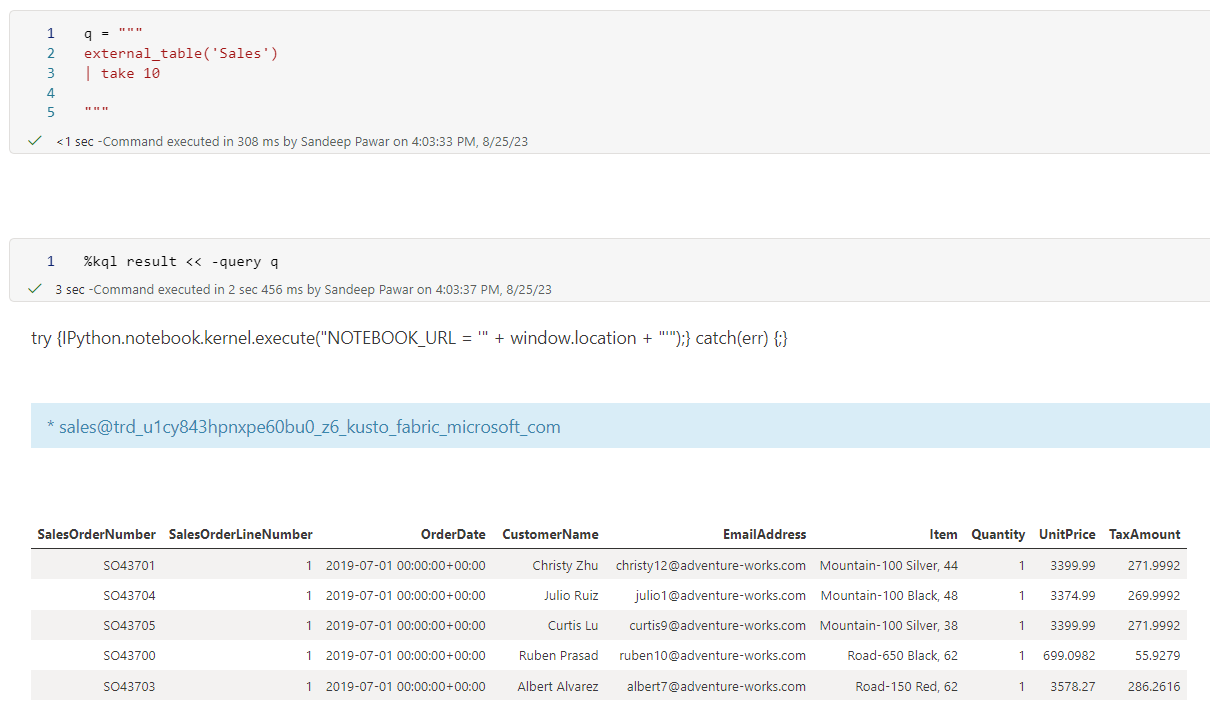
💡If you want to save the result of the inline magic to a variable, you can use %kql result << -query kqlquery where kqlquery is the query you want to run and the result will be saved in variable 'result' which you can use it at any time.
KQL makes time series analysis and plotting very easy. We can use kqlmagic to generate fully interactive plotly charts as well if you render the query
kqlmagic is very handy if you want to query the kql database in ad-hoc fashion. But not great if the resulting dataset is very large because because you will get out of memory errors. To overcome that you can use spark connector.
Using spark
We don't need to do anything special. Just use the below template in the Fabric notebook.
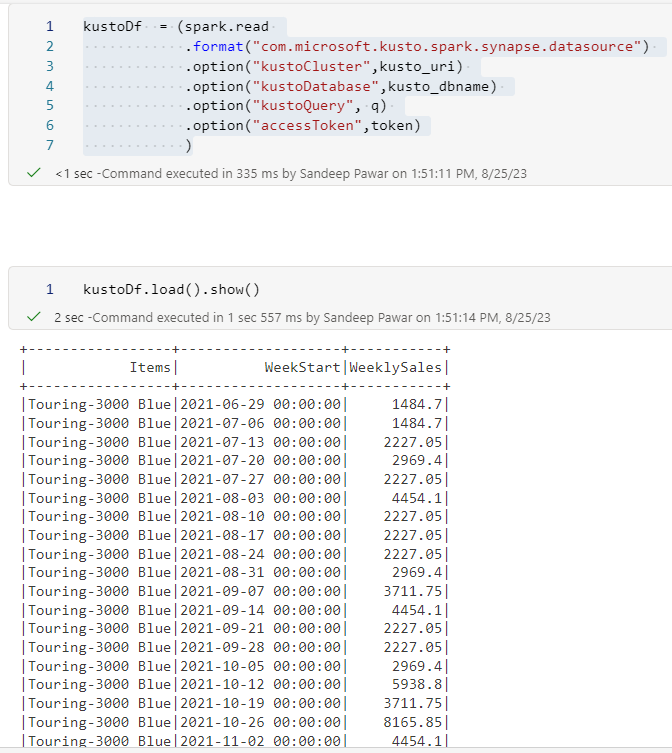
kustoDf  = (spark.read
            .format("com.microsoft.kusto.spark.synapse.datasource")
            .option("kustoCluster",kusto_uri)
            .option("kustoDatabase",kusto_dbname)
            .option("kustoQuery", q)
            .option("accessToken",token)
            ).load()
This will create a pyspark dataframe which you can use like any other dataframe. Unlike kqlmagic this won't render the queries though.
Why
This is all good but why should you bother? Good question. Because this allows you to create more insightful and complex solutions that have never been possible before.
Consider a scenario where you have a clean sales data in the Files section of the lakehouse. You are analyzing it and will build a dimension model out of it, save it as delta table and eventually build a Power BI dataset. Typically any insights you want to surface in your reports, will happen in Power BI because :
the traditional warehousing architecture does not have features to extract complex insights
analysts don't have the tools or access to those tools
using different tools often involves moving data around
This is where Fabric truly shines. We have all the tools necessary without copying the data mutliple times/locations and having to piece different tools/platforms together. Let me show you how:
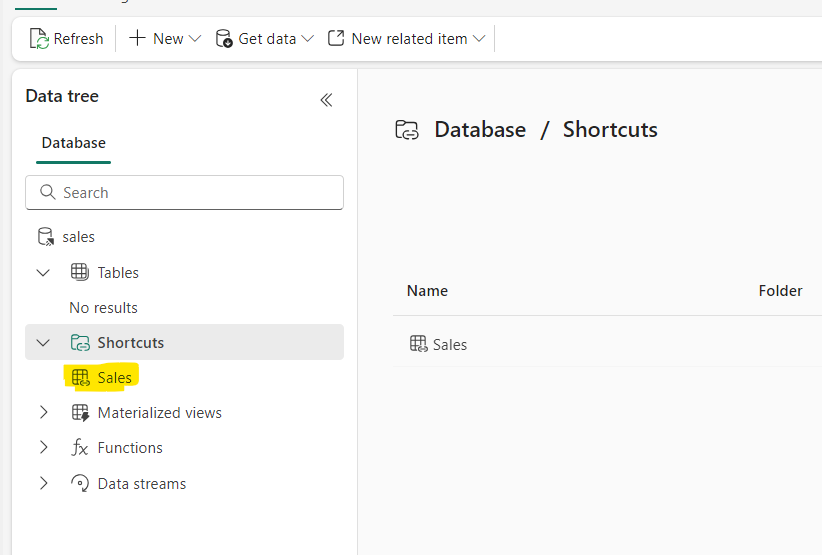
I have the sales data in my lakehouse
I can create a shortcut to the sales data in the kusto database and query it like any other Kusto table
This will allow me to use advanced analytical techniques like clustering, windowing, forecasting, anomaly detection etc on the same data without moving that data to another platform. Sure, we can do the same thing with spark and ML libraries but KQL makes time series analysis far easier and scalable.
I can now run the KQL against the same data in Fabric notebook and integrate that result in the final delta table. When the notebook is refreshed in the pipeline, it will run the KQL query along with the rest of the Python query in the notebook.
For example, in my sales data of 150 million+ rows, I want to identify products that are on an upward trend and surface that insight in the Power BI dataset directly for report authors and users to consume. Below is the KQL query that groups by the sales data for the last 6 months by week and item, averages sales based on 7 day window to smooth out fluctuations, fits a linear model to calculate the slope which I can use to identify top 80th percentile products that are on the upward trend. I can then add a flag in my dimension table that the Power BI developer can use easily. I can even pass Python variables and make the query dynamic based on requirements.
N = 80

q = f"""
let topNcutoff = {N};

let t =
external_table('Sales')
| extend sales = Quantity * UnitPrice
| extend Items = substring(Item, 0, indexof(Item, ','))
| extend WeekStart = startofweek(OrderDate)
| summarize TotalSalesRaw=sum(sales) by WeekStart, Items
| extend TotalSales = round(TotalSalesRaw, 2)
| project WeekStart, Items, TotalSales
| order by Items, WeekStart asc;

let max_t = toscalar(t | summarize max(WeekStart));
let min_t = (max_t-180d);

let slopeData =
t
| make-series WeeklySales=round(avg(TotalSales),2) default=0 on WeekStart from min_t  to max_t step 7d by Items
| extend (slope, intercept) = series_fit_line(WeeklySales);

let p = toscalar(slopeData | summarize percentile(slope, topNcutoff ));

slopeData
| where slope >= p
| mv-expand WeeklySales to typeof(double), WeekStart to typeof(datetime)
| project Items, WeekStart, WeeklySales
| order by Items, WeekStart asc
// | render timechart title = 'Top {N} percentile products on upward trend'
| render timechart title = strcat("Top {N} percentile products on upward trend - [", format_datetime(min_t,"yyyy-MM-dd"), " to ", format_datetime(max_t,"yyyy-MM-dd"), " ]")


"""
If I run this using kqlmagic, I get a nice interactive plot that correctly identifies 9 products that show the highest upward trend which can be saved in the dimension table.
Before you say you could have done this in DAX using moving average, LINEST function etc., let me tell you this is just one example of what's possible. For example, I could decompose this time series to extract trend, and seasonality and choose to use different methods based on the time series structure, something DAX can't do. KQL has many advanced time series analysis capabilities that you can use to enrich your Power BI datasets and reports.
The obligatory - Fabric is still in public preview and features may change at any point.