Boosting Copy Activity Throughput in Fabric
Increased copy throughput by higher CPU utilization
Principal Program Manager, Microsoft Fabric CAT helping users and organizations build scalable, insightful, secure solutions. Blogs, opinions are my own and do not represent my employer.
In all of my Fabric related blog posts, I make it abundantly clear that Fabric is (as of the writing of the post), in public preview and the performance/features may change at any time. I want to discuss one such significant performance improvement in Fabric data factory I discovered that improved the throughput by 22% in my case. The Fabric DI team has enhanced the copy performance by increasing the CPU utilization during the copy process.
Copy Activity
In Fabric, you can use the copy activity to copy the data from a variety of sources (on-premises data sources are not supported yet) to Fabric OneLake. For most small to medium workloads, the out-of-the-box performance is decent. At higher workloads, if you want to boost the performance, there are a few knobs to turn in the "Settings" (see below). You can manually set the "Intelligent throughput optimization", "Degree of copy parallelism" and "Enable staging". Each of them changes different aspects to improve the throughput in various scenarios. You can learn more about them here. My focus in this article is tuning the "Degree of copy parallelism" (DoCP) to boost throughput and potentially reduce capacity units consumed.
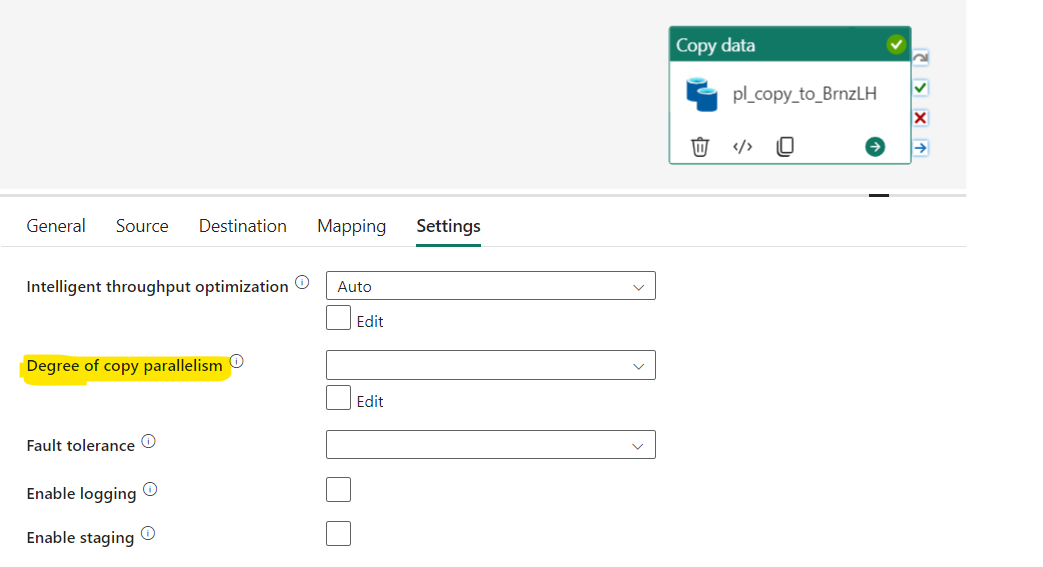
When a pipeline is executed, the necessary computing resources are automatically provisioned. The degree of copy parallelism determines how efficiently the compute resources (i.e., CPU) are utilized by parallelizing the execution. It represents the maximum number of threads within the copy activity that simultaneously read from your source or write to your sink data stores. Copy tasks are distributed across the computing resources to enhance overall throughput. The higher the parallelism, the greater the throughput. In theory, as parallelism increases, the compute resources should execute more tasks within the same fixed resource allocation. I will also discuss when that's not the case.
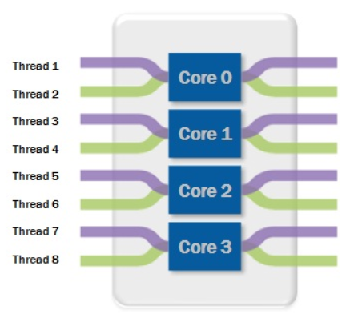
Ref: Image from here
Test data and Setup
I had 291 GB of parquet dataset with 9 billion rows with total 1500 parquet files in OneLake that I wanted to copy to another lakehouse as VORDER'd parquet. In my tests, I first started with the default settings and tweaked the DoCP without changing any other settings.
DoCP: Default settings
With default settings, it took 27 min to copy the data. Notice in the above image that Degree of copy parallelism is blank. Next, I manually changed the settings to test how it affects the throughput.
DoCP : 32
In the dropdown, the max I could set was 32 and ran again without changing any other settings:
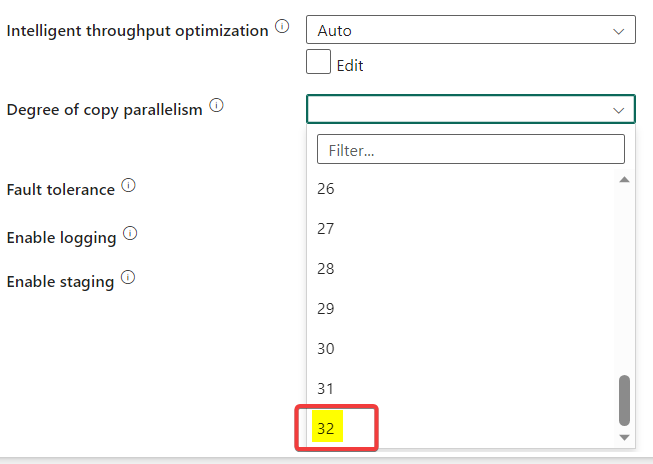
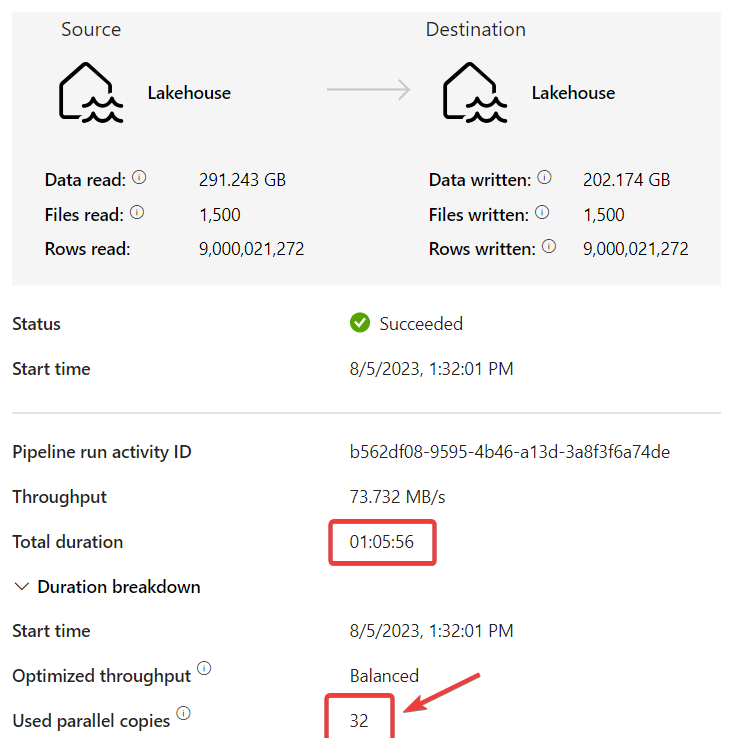
The activity took 66 minutes, compared to 27 minutes after manually changing the setting, which was not what I expected. However, upon closely examining the runtime details of the default settings, I discovered that the default DoCP value is actually 128, even though it appears blank in the UI. This is where the Fabric DI team seems to have made significant performance improvements to optimize the use of the provisioned compute with multithreading. The same activity with default settings took much longer a few weeks ago. With a DoCP = 128, 128 files are being read in parallel!

Next, I kept increasing the DoCP. Below are the results:
| Parallelism | Duration (min) |
| 32 | 66 |
| 128 (Default) | 27 |
| 256 | 25 |
| 512 | 23 |
| 1024 | 21 |
| 1500 | 21 |
As you can see, increasing DoCP up to 1024 shaved off 6 minutes from the run time that's a 22% improvement in performance! Below are some observations and notes:
Increasing DoCP from 32 to 128 was a significant improvement but after that, the improvements were marginal for my copy pair and data. This may not always be the case and will depend on your scenario.
DoCP is the maximum value, i.e., if you set it at 256 but if there are not enough files and/or the source & target cannot handle the parallel execution, copy activity will automatically scale it down to the optimal number but won't exceed the value you set.
In my case, I had 1500 files so I set it at 1500 but copy activity automatically scaled it down to 1476 because that's all it could handle. Notice that increasing DoCP from 1024 to 1500 did not improve the performance.
In some of my other tests (other copy pair and 1TB data), at higher DoCP, the execution was automatically throttled based on what the source & target could handle and the network bandwidth.
Copy activity will automatically find you the best DoCP based on the copy pair, data and intelligent throughput optimization setting. Based on my tests, my recommendation would be to start with the default, observe the value during execution and then tune the number based on the number of files you have. As always, only tests will determine the optimal value.
Since DoCP increases parallelism for the given compute, it should reduce the capacity units consumed. I need to do more tests to confirm this.
To get the best performance that won’t be impacted by other parameters such as cross-region, network, etc, you can :
Move the data to a storage that is in the same region as your Fabric tenant to eliminate the impact of cross-region.
Do not run the copy job against single storage at the same time, to eliminate the impact of storage throttling due to frequent requests or/and bottlenecks from network bandwidth.
This was just one of the settings. You can also tune throughput optimization and look into staging for certain scenarios.
In other tests I have done with 1TB of data, I saw ~10-30% improvement in throughput which can be attributed to the recent improvement in CPU utilization. If you have run any large copy activities in the last few weeks, I would encourage you to run tests again to compare the performance. YMMV but I think you will see a performance improvement.
A keen eye will notice that V-ORDER optimized Parquet with Snappy compression reduced the data size from 291 GB to 200 GB! Interestingly, at DoCP=32, the compression was slightly worse (by 3 GB), and the reason for this is unclear to me. (Btw, I have a blog in the backlog on V-ORDER and compression, stay tuned!)
Note here that this is parallelizing the copy activity for the given copy pair within that activity.
Copy Activity Assistant does not let you change the settings in the UI. To change the settings, uncheck the below option on the last page of the Assistant and then select the activity > Settings

Overall, I believe the Fabric DI team has done an excellent job in enhancing performance, and hopefully, this will continue to improve in the near future. The documentation on this topic is currently scarce, so I hope they will improve that as well and also work on refining the user interface.
As always, the obligatory - Fabric is currently in public preview and the performance & features may change in the future - hopefully for the better! Performance is always dependent on several factors so run tests for your specific use case and let me know what you find.
I want to thank Jianlei Shen, Tina Hu at Microsoft and my colleague Albert Paulraj for their help.