Visualizing Fabric Domain Lineage
Principal Program Manager, Microsoft Fabric CAT helping users and organizations build scalable, insightful, secure solutions. Blogs, opinions are my own and do not represent my employer.
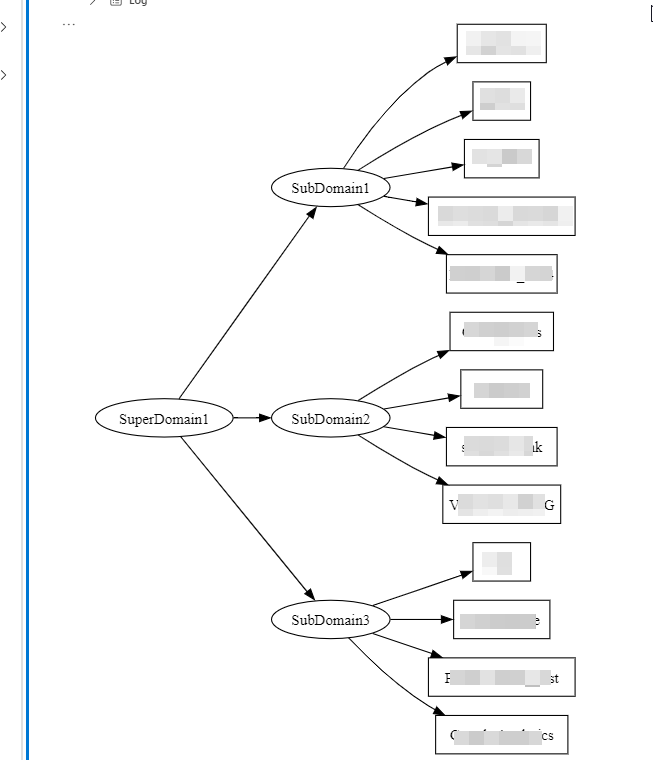
In Fabric, you can use the Domains to create a data mesh architecture. It allows you to organize the data and items by specific business domains within the organization and make the overall data architecture decentralized. You can create domains within domains and assign workspaces to each domain. As it grows, you may find it challenging to understand how the domains & workspaces have been organized. Below code will help you trace the domains, subdomains and the workspaces assigned to them.
It uses the Domains API. You need to be a an O365 Global admin or Fabric admin to get the list of domains.
## Author : Sandeep Pawar  |  fabric.guru
import sempy.fabric as fabric
import pandas as pd
from graphviz import Digraph
from IPython.display import display

client = fabric.FabricRestClient()

def get_domain_ws(domain_id):
    # API call to get workspaces for a specific domain
    response = client.get(f"v1/admin/domains/{domain_id}/workspaces").json()
    return pd.DataFrame(response['value'])['displayName']

def list_domains(client):
    # get all domains
    domains = pd.DataFrame(client.get("v1/admin/domains").json()['domains'])
    domain_data = []
    domain_name_map = domains.set_index('id')['displayName'].to_dict()

    # get domain details
    for _, row in domains.iterrows():
        domain_id = row['id']
        display_name = row['displayName']
        parent_domain_id = row['parentDomainId']
        parent_domain_name = domain_name_map.get(parent_domain_id, 'None')

        try:
            workspaces = get_domain_ws(domain_id).to_list()
        except:
            workspaces = []

        # result df
        domain_data.append({
            'Domain ID': domain_id,
            'Domain Name': display_name,
            'Parent Domain Name': parent_domain_name,
            'Workspaces': ', '.join(workspaces) if workspaces else 'No Workspaces'
        })

    return pd.DataFrame(domain_data)

domains_with_workspaces = list_domains(client)

def visualize_domains(domains_df, orientation='LR'):
    """
    orientation : "LR" default (Left to Right) , "TB": top to bottom
    """
    dot = Digraph(comment="Domain Hierarchy with Workspaces", graph_attr={'rankdir': orientation})

    # nodes
    for _, row in domains_df.iterrows():
        domain_name = row['Domain Name']
        parent_domain_name = row['Parent Domain Name']
        workspaces = row['Workspaces']

        dot.node(domain_name, domain_name)

        if parent_domain_name != 'None':
            dot.edge(parent_domain_name, domain_name)

        if workspaces != 'No Workspaces':
            for workspace in workspaces.split(', '):
                dot.node(workspace, workspace, shape='box')
                dot.edge(domain_name, workspace)

    display(dot)

visualize_domains(domains_with_workspaces, orientation='LR')
Output :
Below the domains, subdomains and workspaces lineage is shown visually. YOu can also get the list as a dataframe using the list_domains() function.